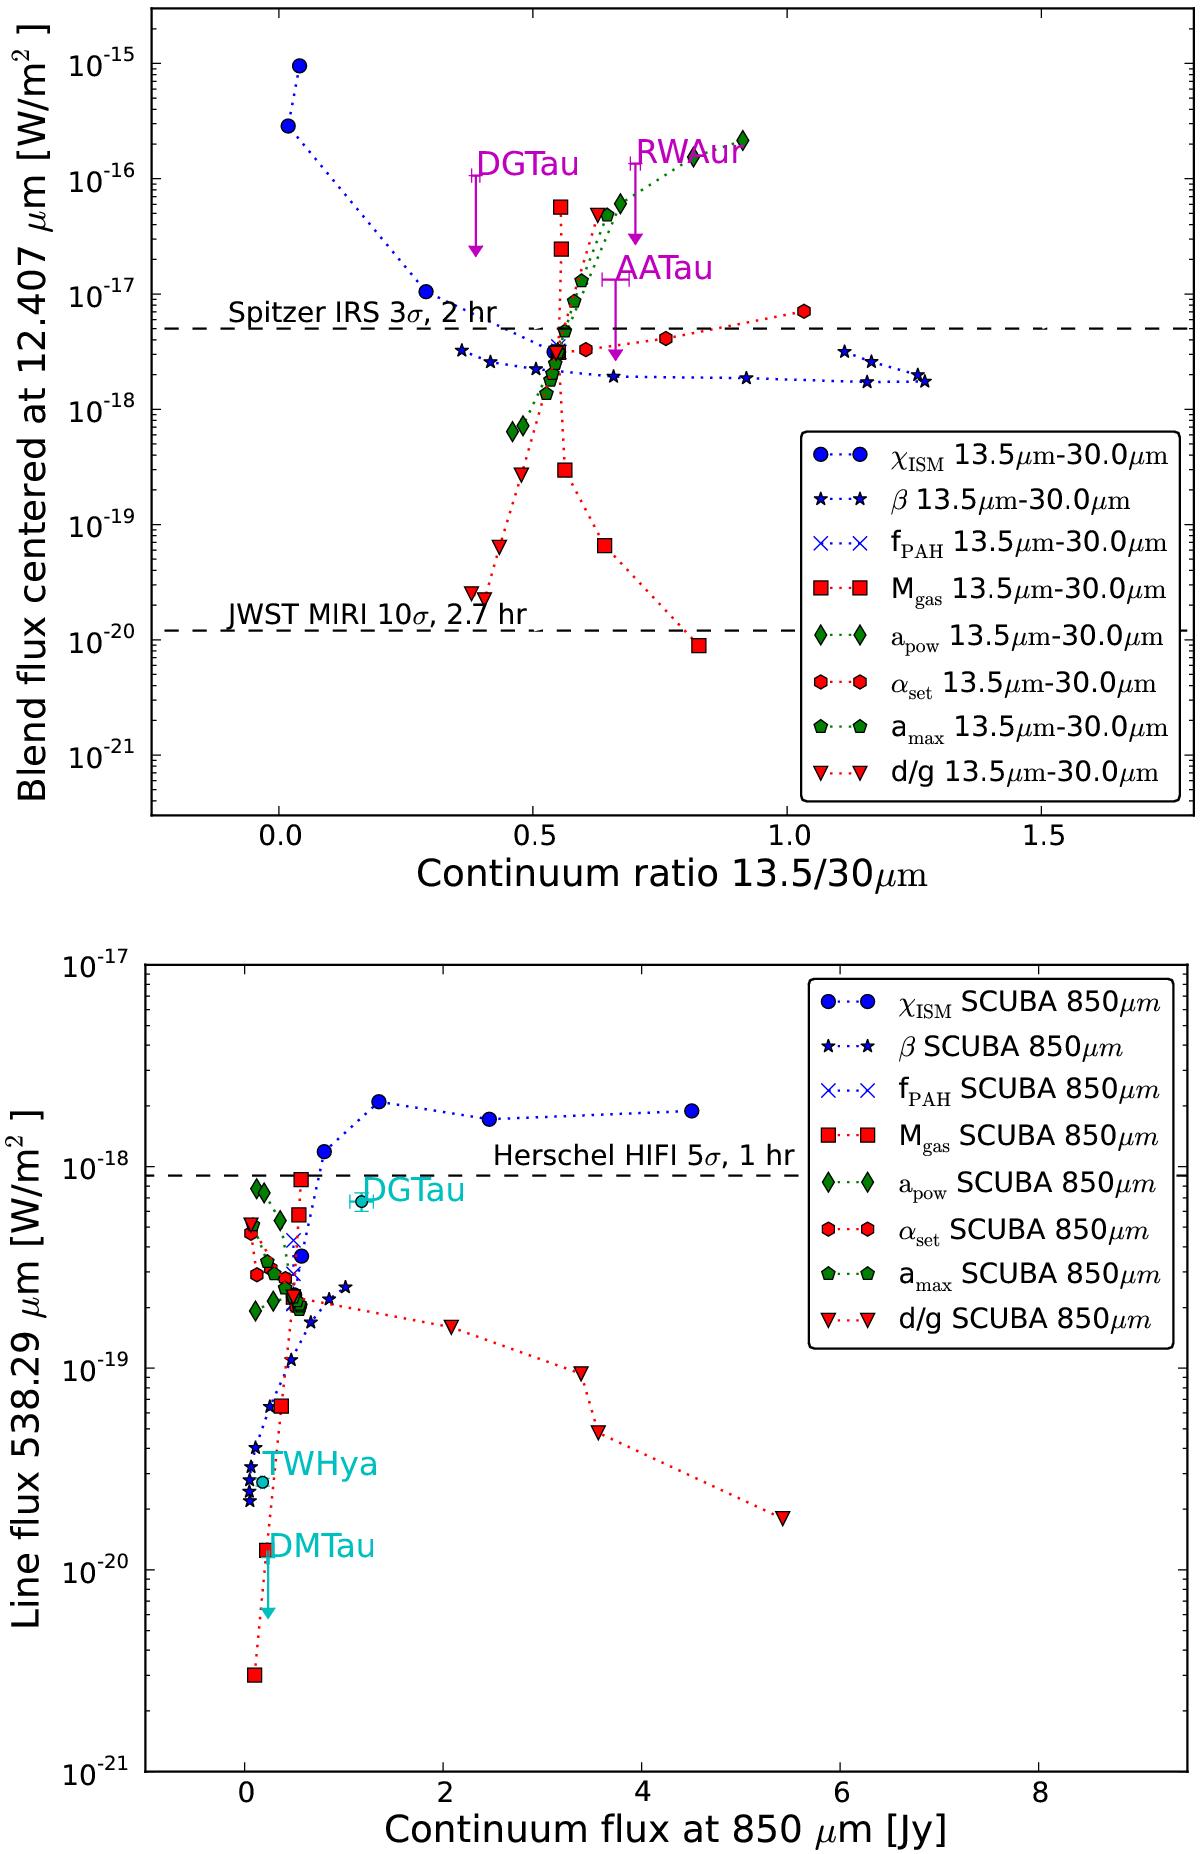
Fig. 6
Download original image
Line fluxes vs. continuum. Top: 12.407 μm versus 13.5/30 IRS continuum flux ratios. Bottom: 538.29 μm versus the 850 μm SCUBA flux. Color code: blue for parameters not affecting the opacity, red for parameters affecting the total continuum opacity, green for parameters affecting the opacity function. Overplotted are the sensitivity limits for Spitzer/IRS, Herschel/HIFI, and JWST/MIRI (references in the text). The magenta data points are Spitzer/IRS observations available for stars with spectral type similar to our model central star, and blend fluxes have been extracted from Spitzer spectra following the procedure described in Appendix D. Cyan data points are the only Herschel/HIFI observations published for this submm line. All line fluxes have been scaled to 140 pc. Arrows indicate upper limits.
Current usage metrics show cumulative count of Article Views (full-text article views including HTML views, PDF and ePub downloads, according to the available data) and Abstracts Views on Vision4Press platform.
Data correspond to usage on the plateform after 2015. The current usage metrics is available 48-96 hours after online publication and is updated daily on week days.
Initial download of the metrics may take a while.