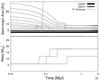
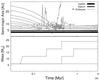
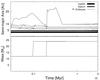
Fig. 5
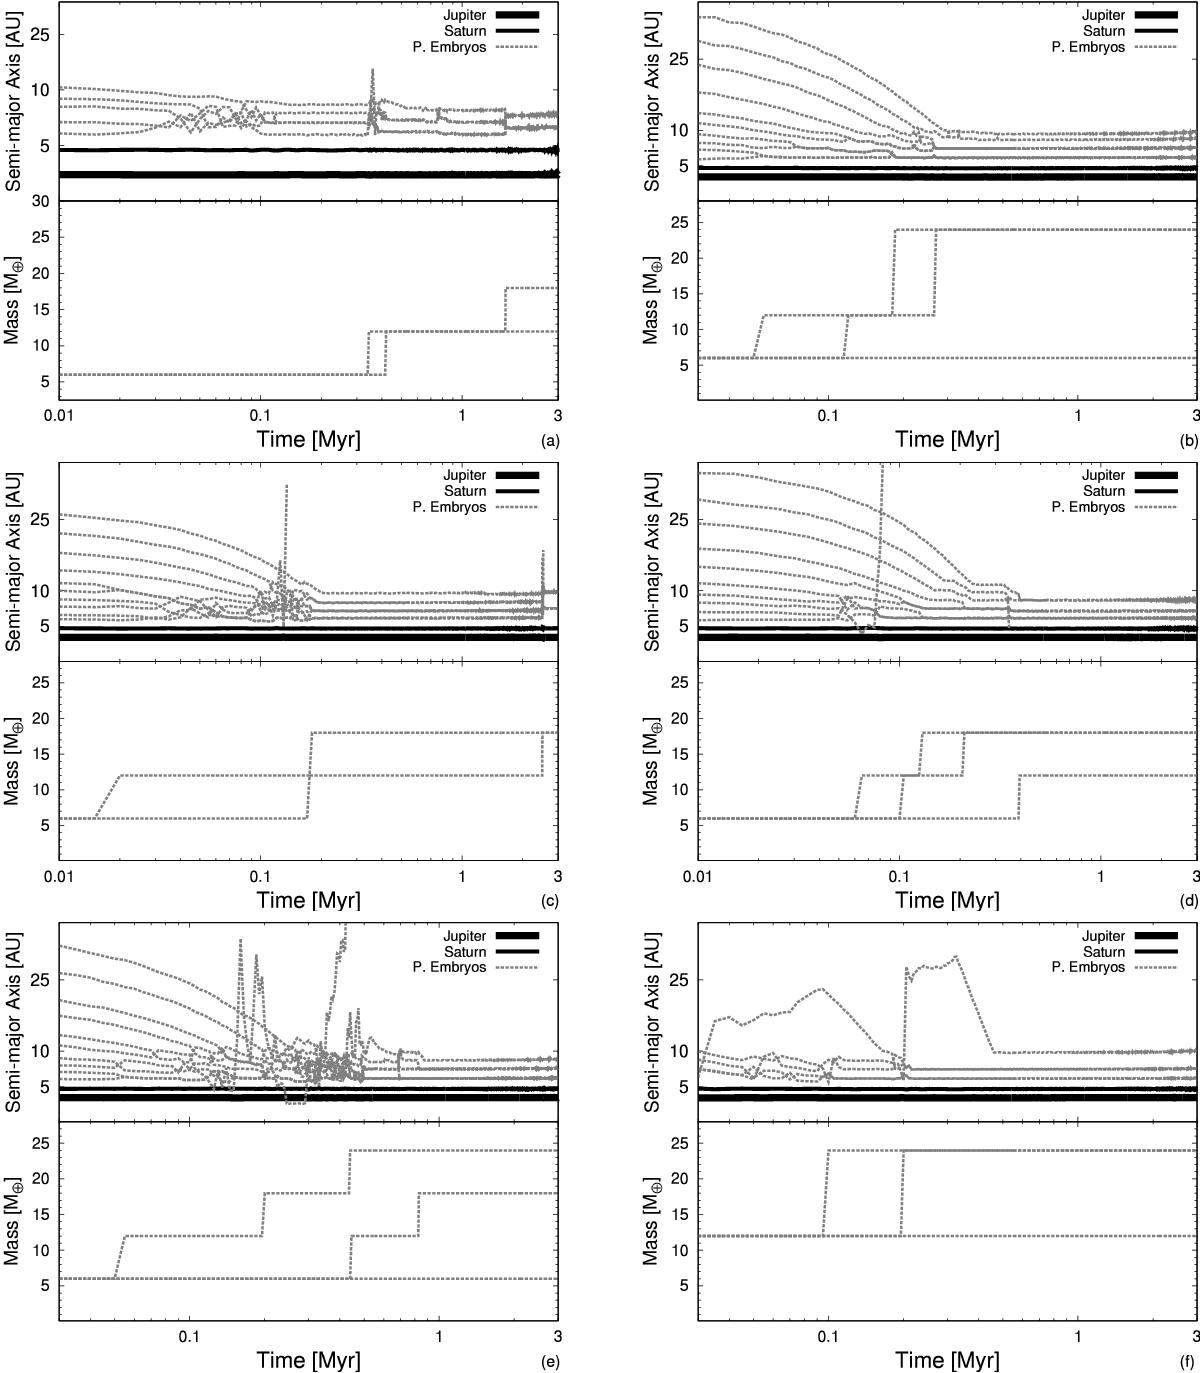
Evolution of planetary embryos leading to the formation of Uranus and Neptune “analogs” in six different simulations. Six panels are shown and labeled from a) to f). Each panel refers to a different simulation and is composed of two sticking plots. The upper panel shows the time evolution of the semimajor axis of all migrating planetary embryos (gray) and giant planets (black). The lower panel shows the time evolution of the mass of those planetary embryos or cores surviving until the end of our integrations.
Current usage metrics show cumulative count of Article Views (full-text article views including HTML views, PDF and ePub downloads, according to the available data) and Abstracts Views on Vision4Press platform.
Data correspond to usage on the plateform after 2015. The current usage metrics is available 48-96 hours after online publication and is updated daily on week days.
Initial download of the metrics may take a while.