Free Access
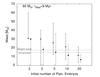
Fig. 4
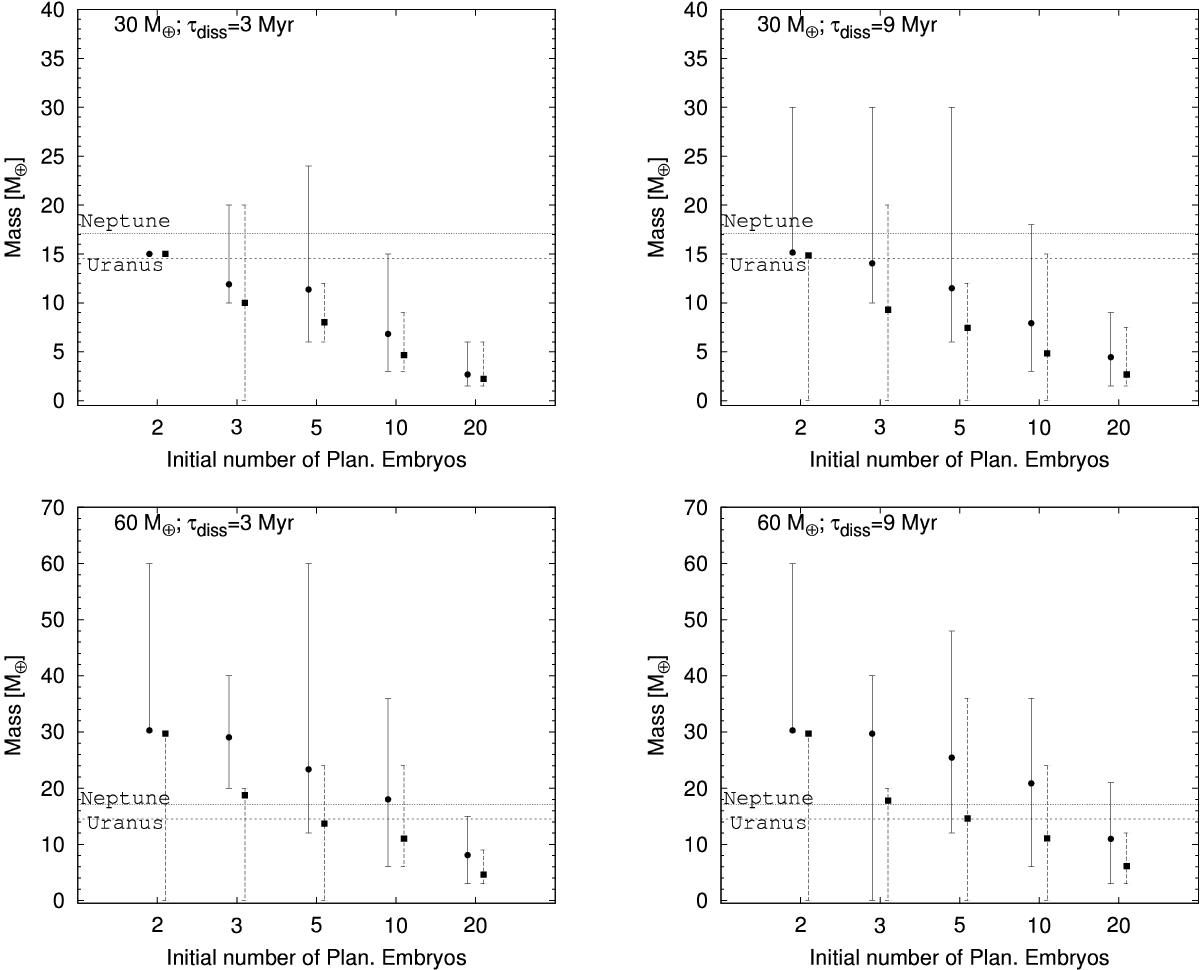
Masses of the innermost and second innermost core surviving beyond Saturn for our different sets of simulations. The filled circles and squares show the mean mass for the innermost and second innermost cores, respectively; the vertical bars range from the highest to the lowest values.
This figure is made of several images, please see below:
Current usage metrics show cumulative count of Article Views (full-text article views including HTML views, PDF and ePub downloads, according to the available data) and Abstracts Views on Vision4Press platform.
Data correspond to usage on the plateform after 2015. The current usage metrics is available 48-96 hours after online publication and is updated daily on week days.
Initial download of the metrics may take a while.