Fig. 3
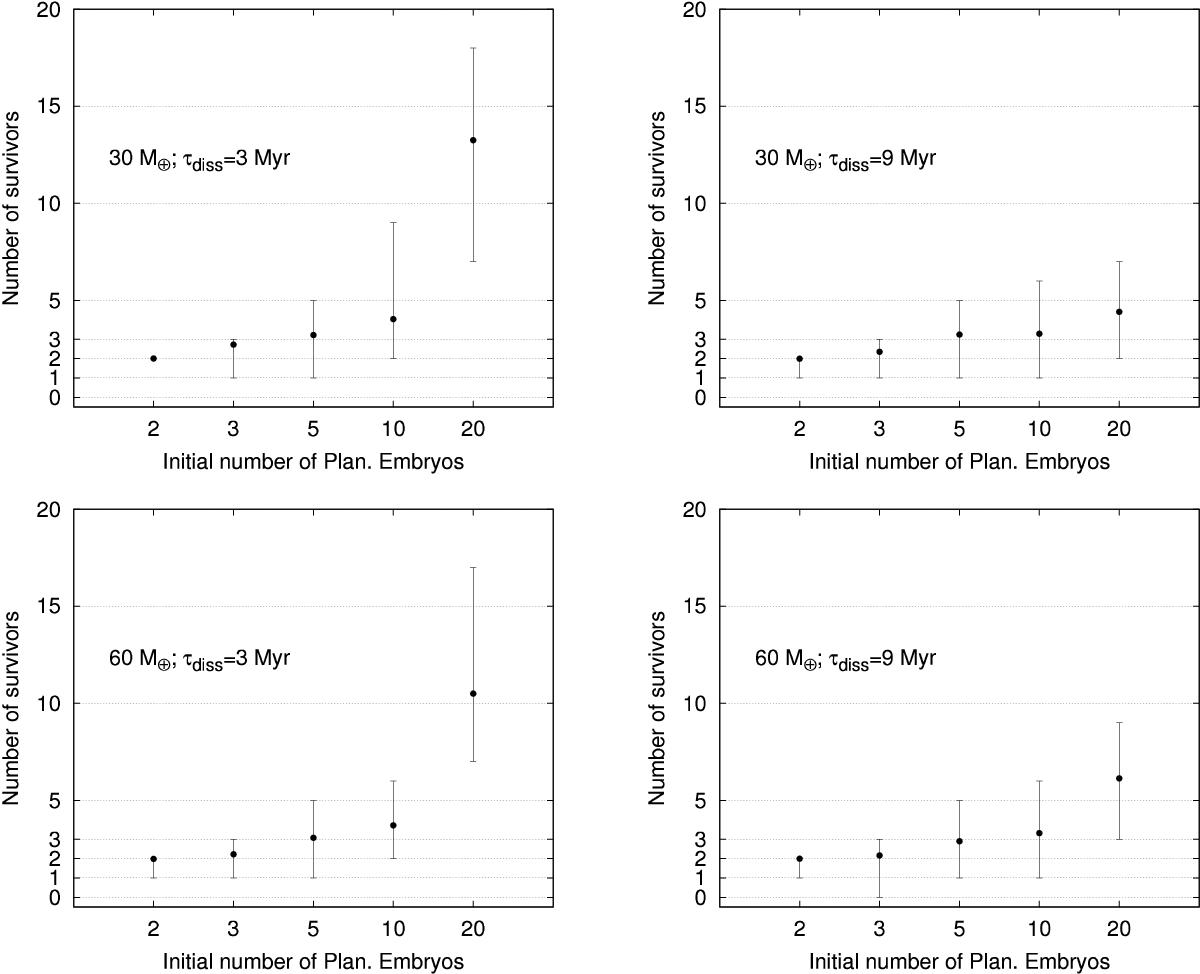
Statistical analysis of the results of all simulations. The x-axis shows the initial number of planetary embryos in the simulations. The y-axis shows the final number of cores surviving beyond the orbit of Saturn. The filled circles shows the mean values calculated over those simulations that did not produce jumper planets. The vertical error bar shows the highest and lowest values within the sample over which the mean value was calculated. The total initial mass of the disk and the gas dissipation timescale is shown in each panel.

Current usage metrics show cumulative count of Article Views (full-text article views including HTML views, PDF and ePub downloads, according to the available data) and Abstracts Views on Vision4Press platform.
Data correspond to usage on the plateform after 2015. The current usage metrics is available 48-96 hours after online publication and is updated daily on week days.
Initial download of the metrics may take a while.