Fig. 2
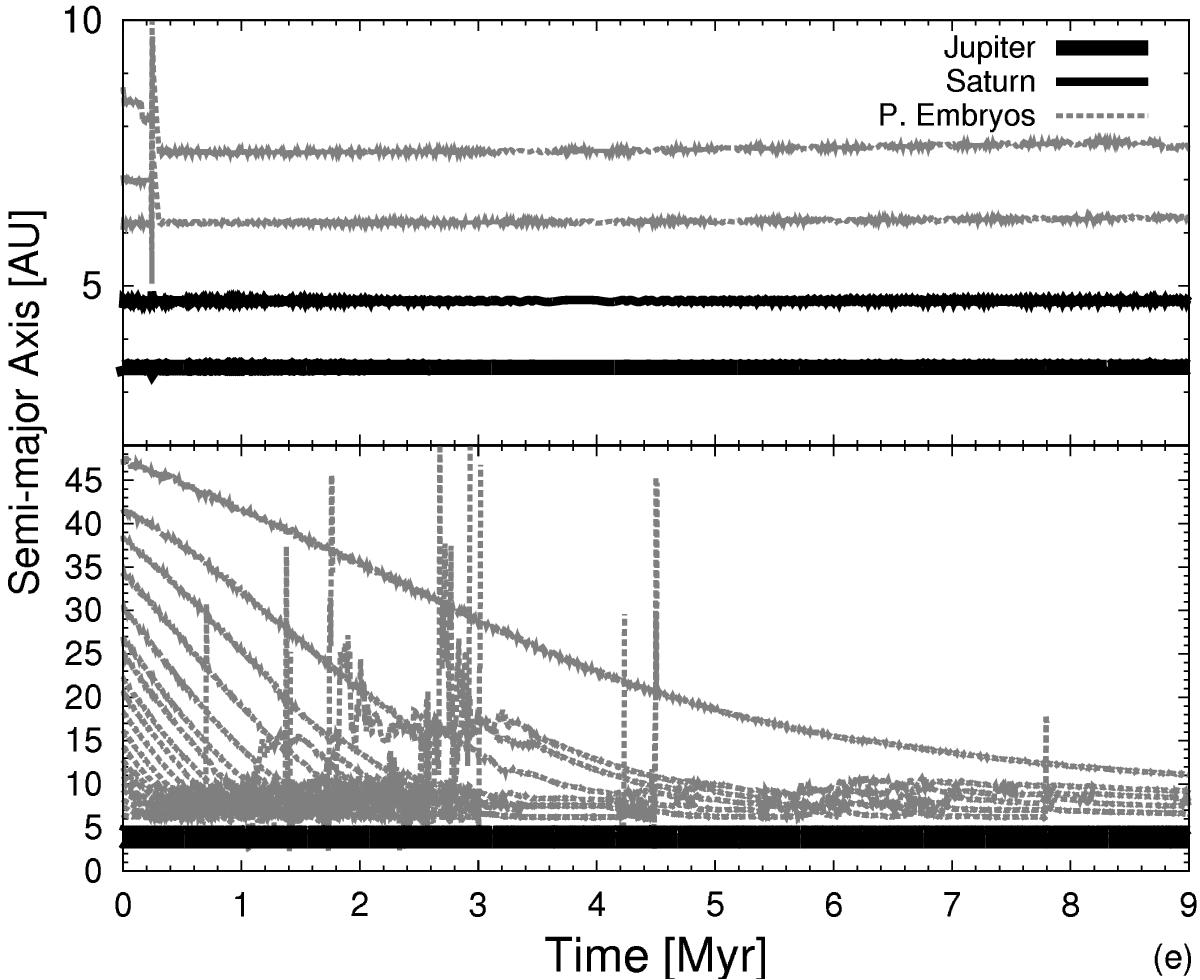
Typical dynamical evolution of a population of planetary embryos in two different simulations. In both plots, the horizontal axis represents the time and the vertical one shows the semimajor axis. The upper panel shows the dynamical evolution of three planetary embryos or cores of 10 M⊕ each. The lower panel shows the dynamical evolution of a numerous population of 20 planetary embryos of 1.5 M⊕ each. In both simulations the gas lasts 9 Myr.
Current usage metrics show cumulative count of Article Views (full-text article views including HTML views, PDF and ePub downloads, according to the available data) and Abstracts Views on Vision4Press platform.
Data correspond to usage on the plateform after 2015. The current usage metrics is available 48-96 hours after online publication and is updated daily on week days.
Initial download of the metrics may take a while.