Fig. 11
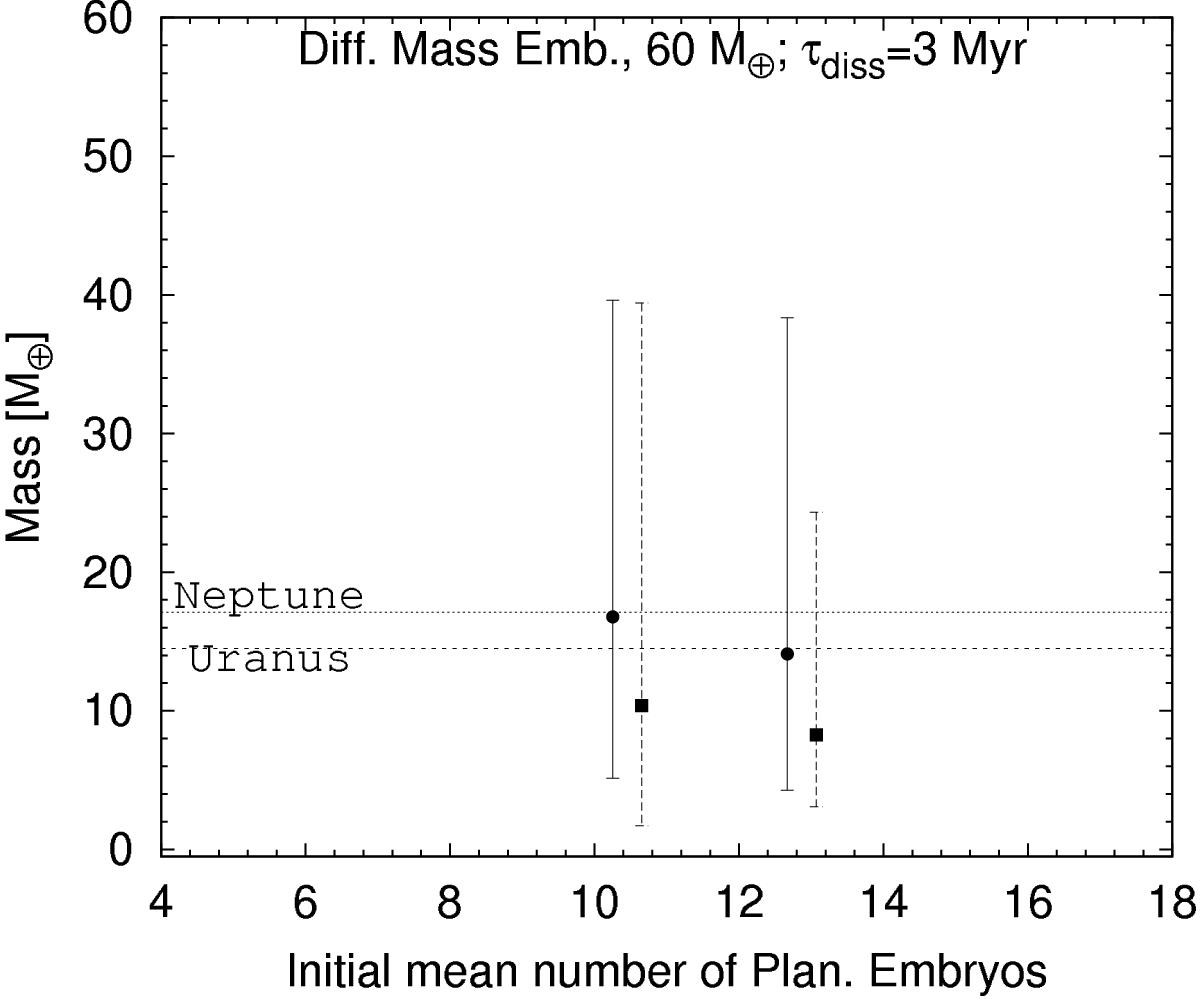
Similar to Fig. 4, but for simulations initially considering different masses for the planetary embryos. In this case, we plot the initial mean number of planetary embryos (the range over which this number is calculated is shown by the horizontal error bars in Fig. 10) against the mean mass of the innermost and second innermost planetary cores formed beyond Saturn. The range over which this mean value is calculated is shown by the vertical error bars.
Current usage metrics show cumulative count of Article Views (full-text article views including HTML views, PDF and ePub downloads, according to the available data) and Abstracts Views on Vision4Press platform.
Data correspond to usage on the plateform after 2015. The current usage metrics is available 48-96 hours after online publication and is updated daily on week days.
Initial download of the metrics may take a while.