Fig. 9
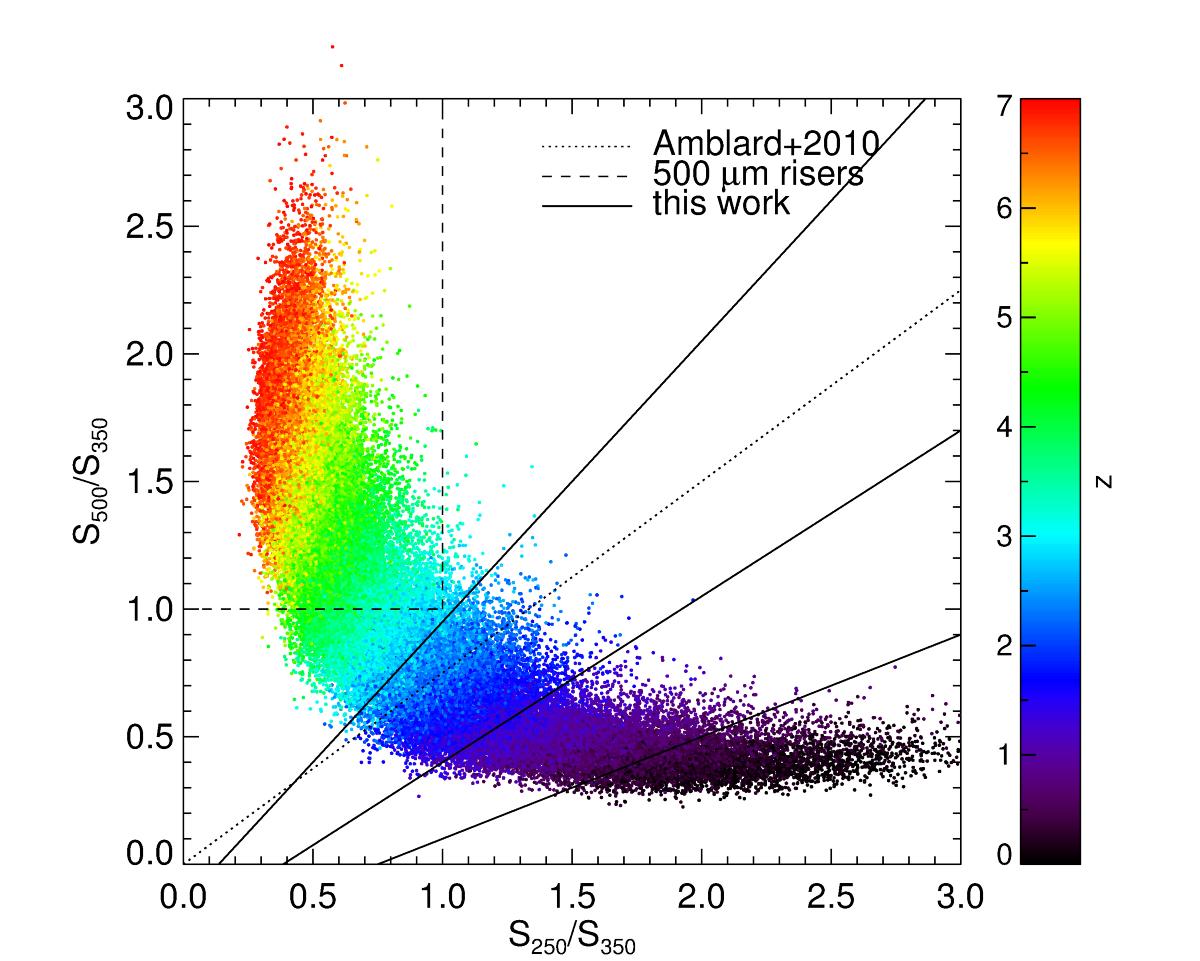
Color–color diagram of the 70 000 mock galaxies generated from M12 templates. The color indicates the redshift of the mock galaxy. The dotted line shows the color cut given by Amblard et al. (2010). Galaxies above this line are expected to have z ~ 2.6 and those under it are expected to have z ~ 1.8. The dashed line shows the selection of 500μm risers. The upper left region separated by this line selects galaxies with z> 4. The solid lines are our color cut method according to the distribution of the mock galaxies. The solid lines divided the diagram into four parts. From lower right to upper left these parts select galaxies at z< 0.5, 0.5 <z< 1.5, 1.5 <z< 2.5 and z> 2.5.
Current usage metrics show cumulative count of Article Views (full-text article views including HTML views, PDF and ePub downloads, according to the available data) and Abstracts Views on Vision4Press platform.
Data correspond to usage on the plateform after 2015. The current usage metrics is available 48-96 hours after online publication and is updated daily on week days.
Initial download of the metrics may take a while.