Fig. 8
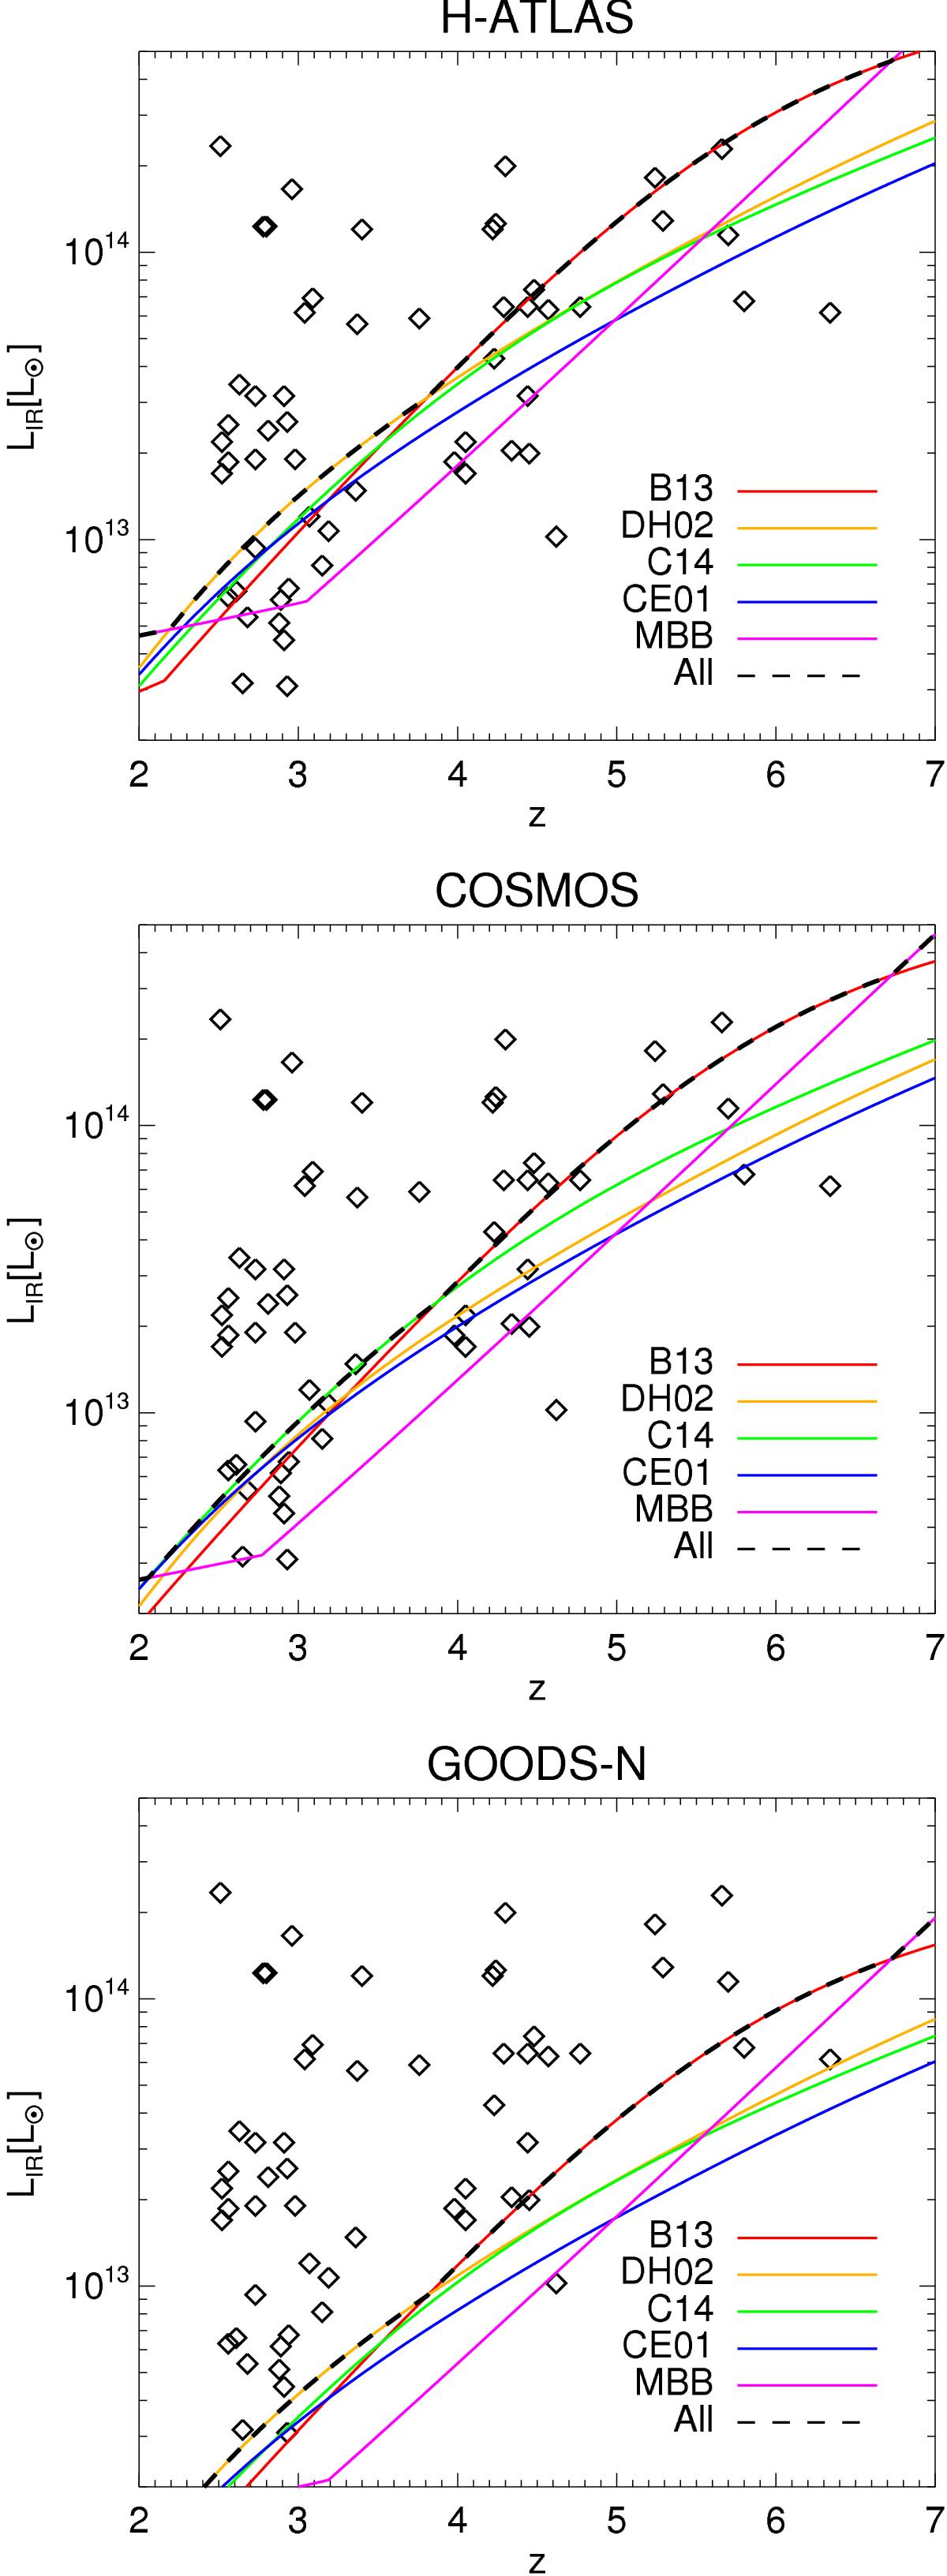
Completeness limits LIR for detecting all SED shapes. The upper, middle, and bottom panels show the complete limits for H-ATLAS, COSMOS, and GOODS-N surveys, respectively. In each panel, the galaxies of our high-z sample are plotted as diamonds (LIR from Table 1), and the LIR for each SED template is plotted in colored line (red: B13; yellow: DH02 with α = 2.5; green: C14; blue: CE01 with LIR = 109L⊙; magenta: MBB with T = 40 K). The black line is the maximum of the colored lines, above which the observation should not be biased against these SEDs.
Current usage metrics show cumulative count of Article Views (full-text article views including HTML views, PDF and ePub downloads, according to the available data) and Abstracts Views on Vision4Press platform.
Data correspond to usage on the plateform after 2015. The current usage metrics is available 48-96 hours after online publication and is updated daily on week days.
Initial download of the metrics may take a while.