Fig. 7
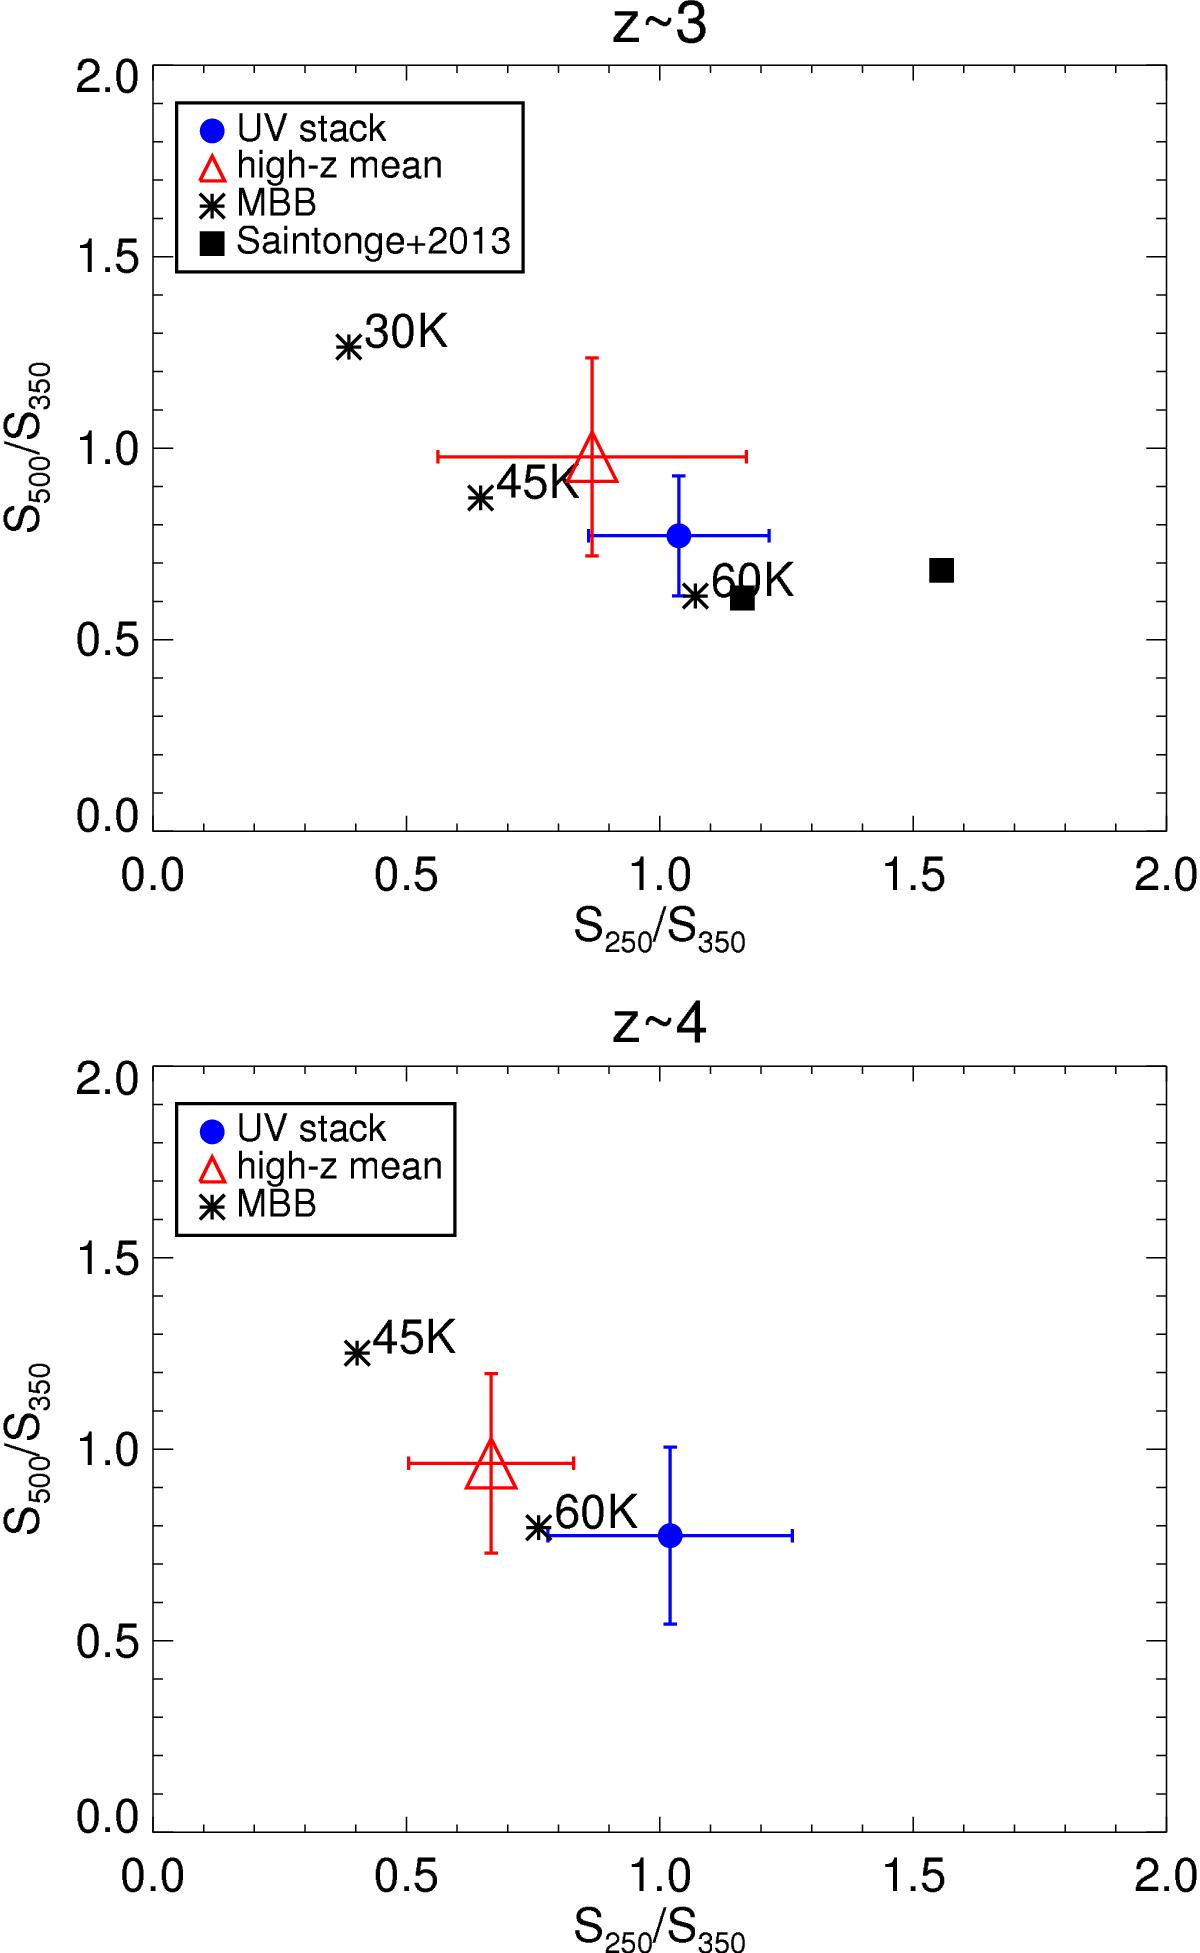
Comparison of SPIRE colors for UV-selected galaxies from Heinis et al. (2014; blue) and our high-z sample (red) at z ~ 3 (upper panel) and z ~ 4 (lower panel). In each panel, the blue dots show the colors derived from the stacked UV sample from Heinis et al. (2014). The red triangle indicates the average colors of our high-z sample. The error bar indicates the standard deviation. Filled black squares present colors for the galaxies from Saintonge et al. (2013). The asterisks indicate the colors given by MBB models with dust temperatures of 30 K, 45 K, and 60 K.
Current usage metrics show cumulative count of Article Views (full-text article views including HTML views, PDF and ePub downloads, according to the available data) and Abstracts Views on Vision4Press platform.
Data correspond to usage on the plateform after 2015. The current usage metrics is available 48-96 hours after online publication and is updated daily on week days.
Initial download of the metrics may take a while.