Fig. 5
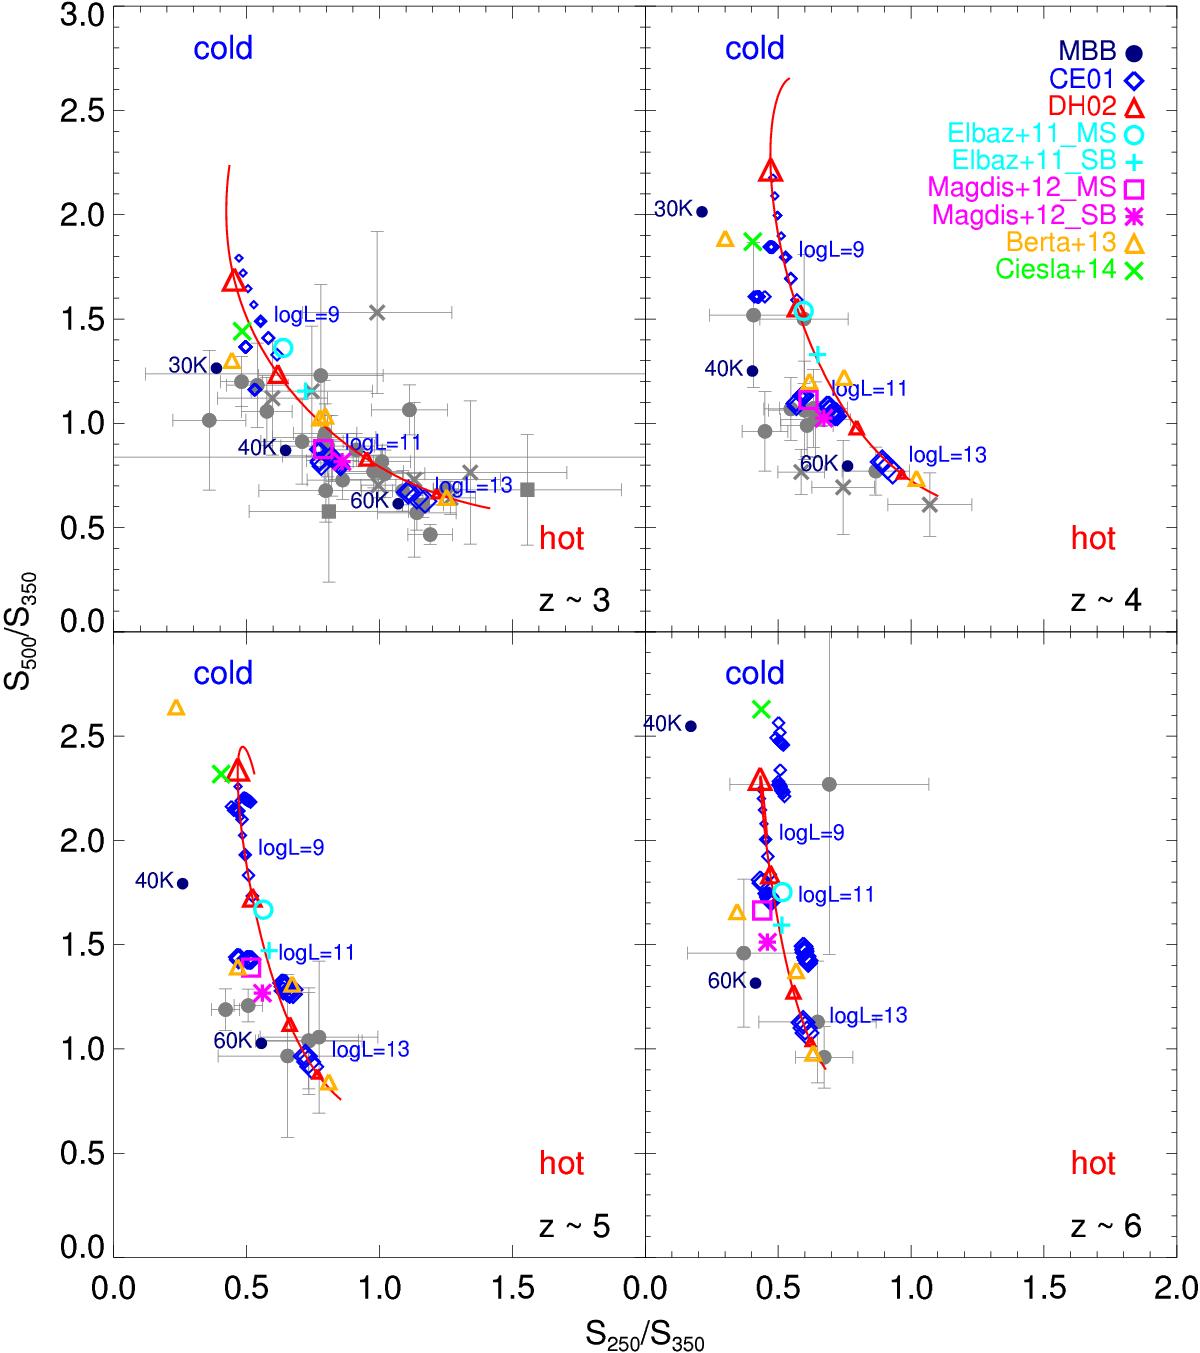
Comparison of the high-z observations and the SED templates on the SPIRE color–color diagram in different redshift bins (z~3, 4, 5 and 6). The observation data are in gray and the results of the templates are in color. The SED templates plotted in the figure include: 1) MBB models with T = 30, 45 and 60 K (navy dots); 2) templates of CE01 (blue open diamonds, the sizes of which are increased with the IR luminosity); 3) templates of DH02 (red line) with α = 1.0, 1.5, 2.0, and 2.5 marked in triangles with increasing sizes; 4) MS and SB templates of E11 (cyan circles and plus signs); 5) MS and SB templates of M12 (magenta squares and asterisks); 6) four selected templates of B13 (yellow open triangles); 7) the templates of C14 (green crosses). The data plotted in the figure include galaxies from Table 1. The data from Saintonge et al. (2013) are shown in gray squares, those from Casey et al. (2012) and Roseboom et al. (2012) are shown in gray crosses, and the data from other works are shown in gray dots.
Current usage metrics show cumulative count of Article Views (full-text article views including HTML views, PDF and ePub downloads, according to the available data) and Abstracts Views on Vision4Press platform.
Data correspond to usage on the plateform after 2015. The current usage metrics is available 48-96 hours after online publication and is updated daily on week days.
Initial download of the metrics may take a while.