Free Access
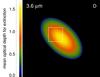
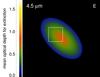
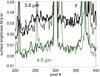
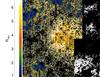
Fig. 9
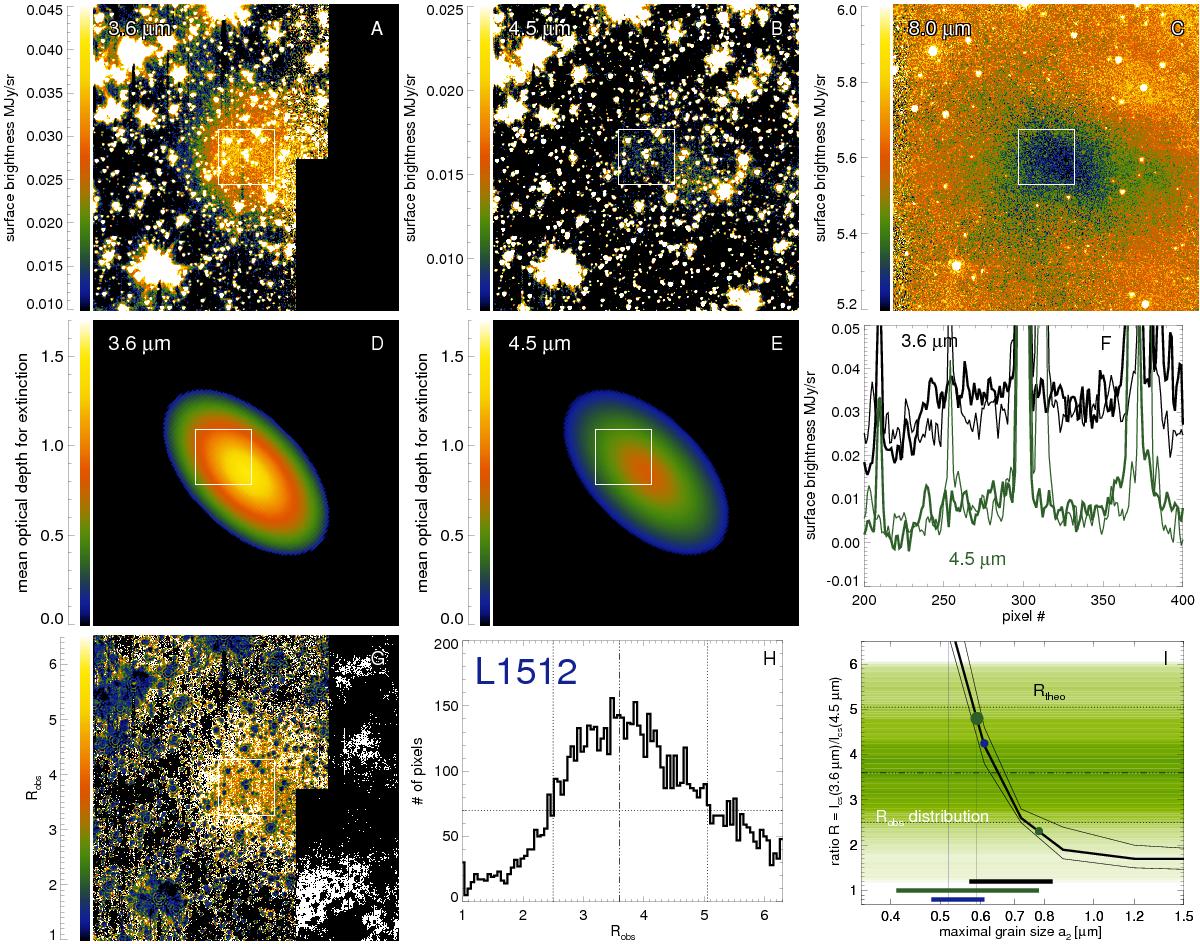
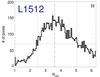
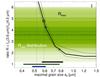
Data analysis for L1512 (CB27). For detailed legend see Fig. 5. Panel A) contains an image border that leads to meaningless ratios in panel G) in the dark righthand area. Panel I) compares the observed (dashed) and theoretical (solid) R distribution characterized by the mean value (thick) and the FWHM values (thin).
This figure is made of several images, please see below:
Current usage metrics show cumulative count of Article Views (full-text article views including HTML views, PDF and ePub downloads, according to the available data) and Abstracts Views on Vision4Press platform.
Data correspond to usage on the plateform after 2015. The current usage metrics is available 48-96 hours after online publication and is updated daily on week days.
Initial download of the metrics may take a while.