Free Access
Fig. 8
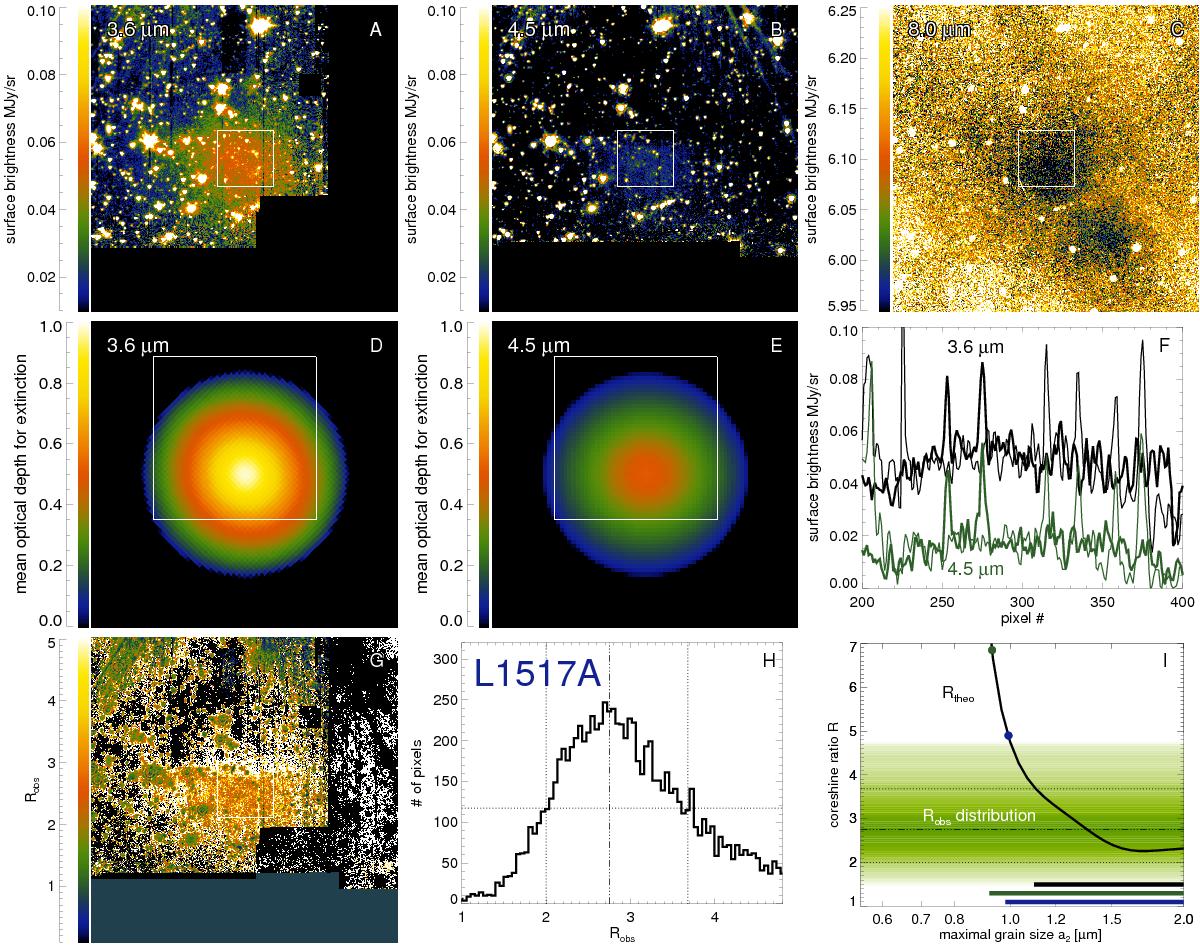
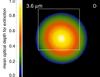
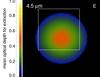
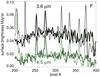
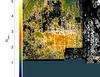
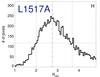
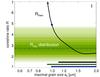
Data analysis for L1517A. For detailed legend see Fig. 5. The core was located at the IRAC 1 and 2 image borders leading to a dark zones in panels A), B), and G), (Here the R values in the dark lower and right zones are not meaningful.)
This figure is made of several images, please see below:
Current usage metrics show cumulative count of Article Views (full-text article views including HTML views, PDF and ePub downloads, according to the available data) and Abstracts Views on Vision4Press platform.
Data correspond to usage on the plateform after 2015. The current usage metrics is available 48-96 hours after online publication and is updated daily on week days.
Initial download of the metrics may take a while.