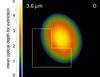
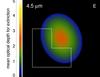
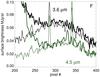
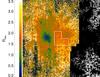
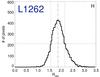
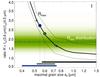
Fig. 7
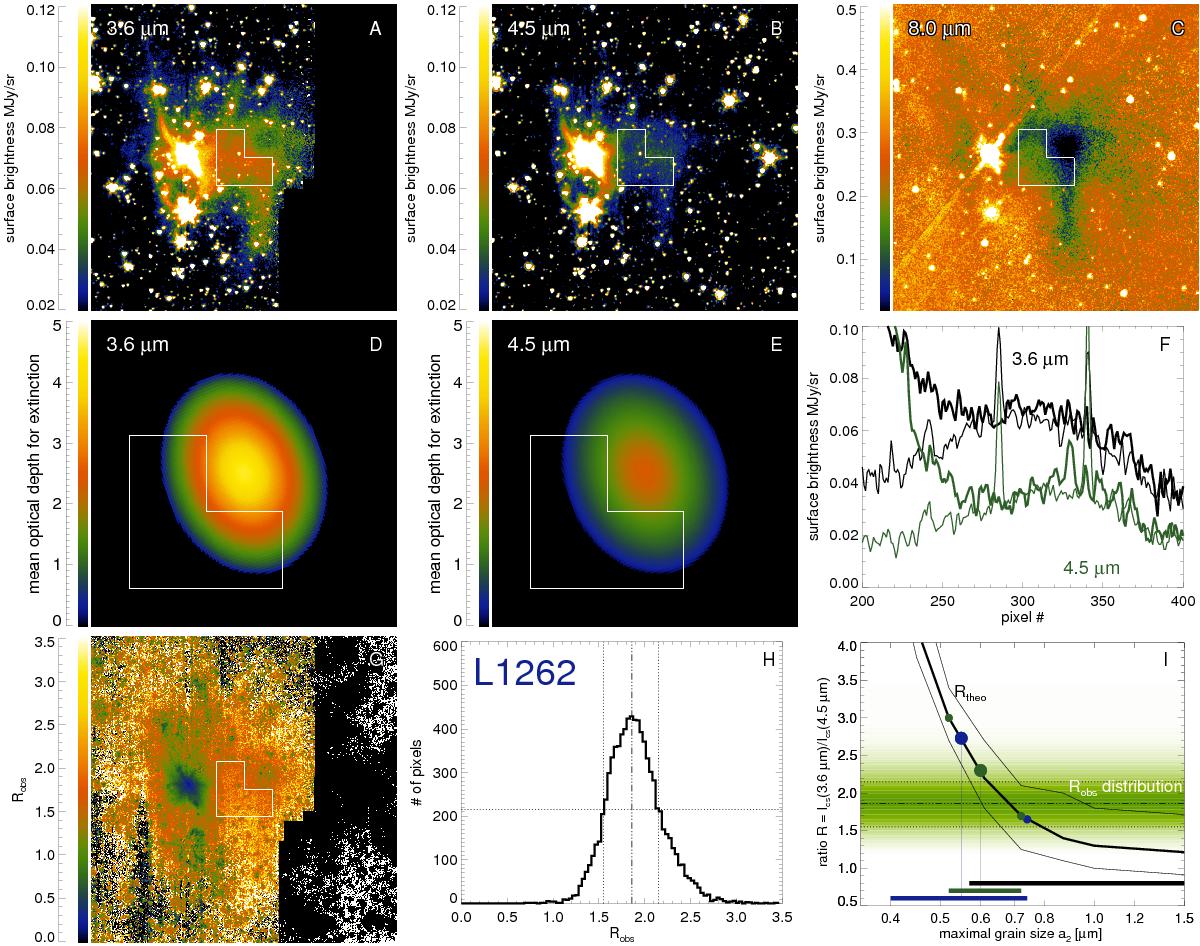
Data analysis for L1262. For detailed legend see Fig. 5. The binary core harbors a YSO to the left. The core was located at the IRAC 1 image border leading to a dark zone in panels A) and G). (The R values in the dark right zone are not meaningful.) Since the modeling is performed using full RT, panel I) compares the observed R distribution as color-coded and the theoretical R-distribution with a thick solid line for the mean value of the theoretical R distribution and half maximum values as thin lines.
Current usage metrics show cumulative count of Article Views (full-text article views including HTML views, PDF and ePub downloads, according to the available data) and Abstracts Views on Vision4Press platform.
Data correspond to usage on the plateform after 2015. The current usage metrics is available 48-96 hours after online publication and is updated daily on week days.
Initial download of the metrics may take a while.