Fig. 5

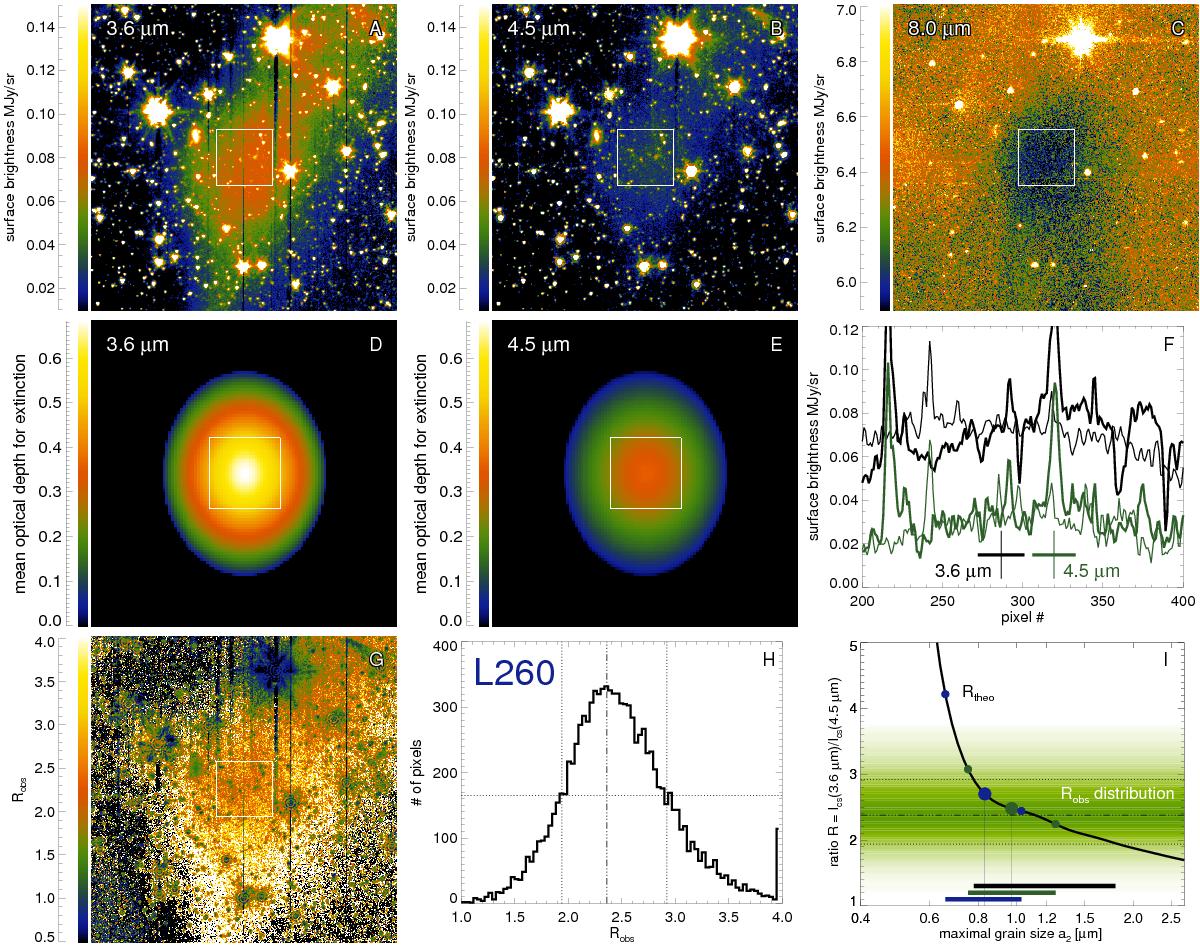
Data analysis for L260. Warm Spitzer IRAC surface brightness maps (off-subtracted) at 3.6 and 4.5 μm (panels A), B)) and cold Spitzer map at 8 μm (panel C) in a 5.5′ × 5.5′ region around the core. The white square indicates the 1.1′ × 1.1′-region where surface brightness ratios have been measured. The optical depth for extinction of external radiation passing through the core and to the observer (directionally averaged) for a core with the overall properties of L260 is shown in panels D) and E) (3.6 and 4.5 μm). Panel F): horizontal (thick) and vertical (thin) cuts through the central 200 pixel in the two bands (black for 3.6 μm and green for 4.5 μm). Panel G): map of the ratio of the off-subtracted surface brightnesses R at 3.6 and 4.5 μm. Panel H) shows the R pixel number distribution within the white square (pixels affected by point sources or by the column-pulldown effect have been masked). Panel I): Rtheo as a function of the maximum grain size a2 (thick black), with the notation from Fig. 4. The observational R-distribution from panel H) is plotted and color-coded, and both the maximum value and the two half-maximum values are plotted as dashed lines. The horizontal black bar indicates the a2 agreement range of Rtheo and Robs.
Current usage metrics show cumulative count of Article Views (full-text article views including HTML views, PDF and ePub downloads, according to the available data) and Abstracts Views on Vision4Press platform.
Data correspond to usage on the plateform after 2015. The current usage metrics is available 48-96 hours after online publication and is updated daily on week days.
Initial download of the metrics may take a while.


