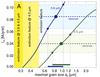
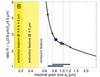
Fig. 4

Panel A): background-subtracted theoretical surface brightness through the core center at 3.6 (4.5) μm in blue (green), respectively (see Eq. (7)) as a function of the maximum grain size of the dust size distribution for the core L260. The roots of both functions indicate the regions where the core becomes visible in excess of emission for each wavelength (region outside yellow regions). The dashed lines give the observed maximum coreshine value with its error range, and the dots label the crossing points with the theoretical curve. Panel B): resulting theoretical ratio Rtheo of the surface brightnesses shown in panel A) as a function of the maximum grain size. The dots from panel A) mark the agreement of the central surface brightnesses with the observed range for each wavelength.
Current usage metrics show cumulative count of Article Views (full-text article views including HTML views, PDF and ePub downloads, according to the available data) and Abstracts Views on Vision4Press platform.
Data correspond to usage on the plateform after 2015. The current usage metrics is available 48-96 hours after online publication and is updated daily on week days.
Initial download of the metrics may take a while.