Free Access
Fig. 8
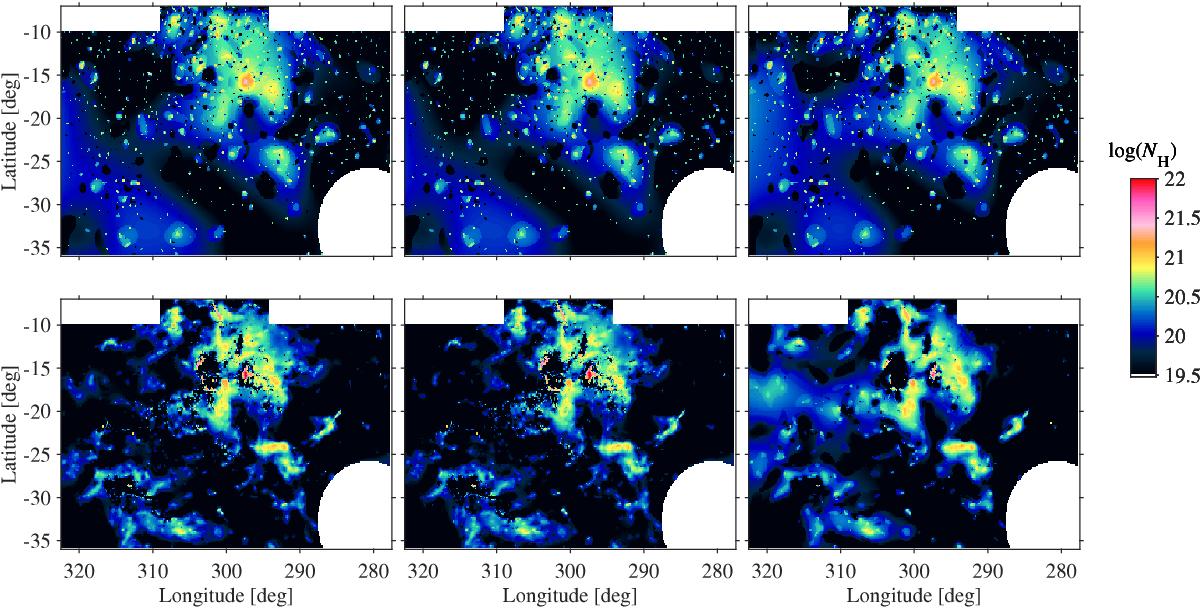
Gas column-density maps in the DNM (in cm-2) obtained from the γ-ray (upper row) and the dust (lower row) data after subtraction of the best-fit NH i and WCO contributions and other components unrelated to gas. The dust tracers are respectively AVQ, τ353, and Rfrom left to right.
Current usage metrics show cumulative count of Article Views (full-text article views including HTML views, PDF and ePub downloads, according to the available data) and Abstracts Views on Vision4Press platform.
Data correspond to usage on the plateform after 2015. The current usage metrics is available 48-96 hours after online publication and is updated daily on week days.
Initial download of the metrics may take a while.