Fig. 2
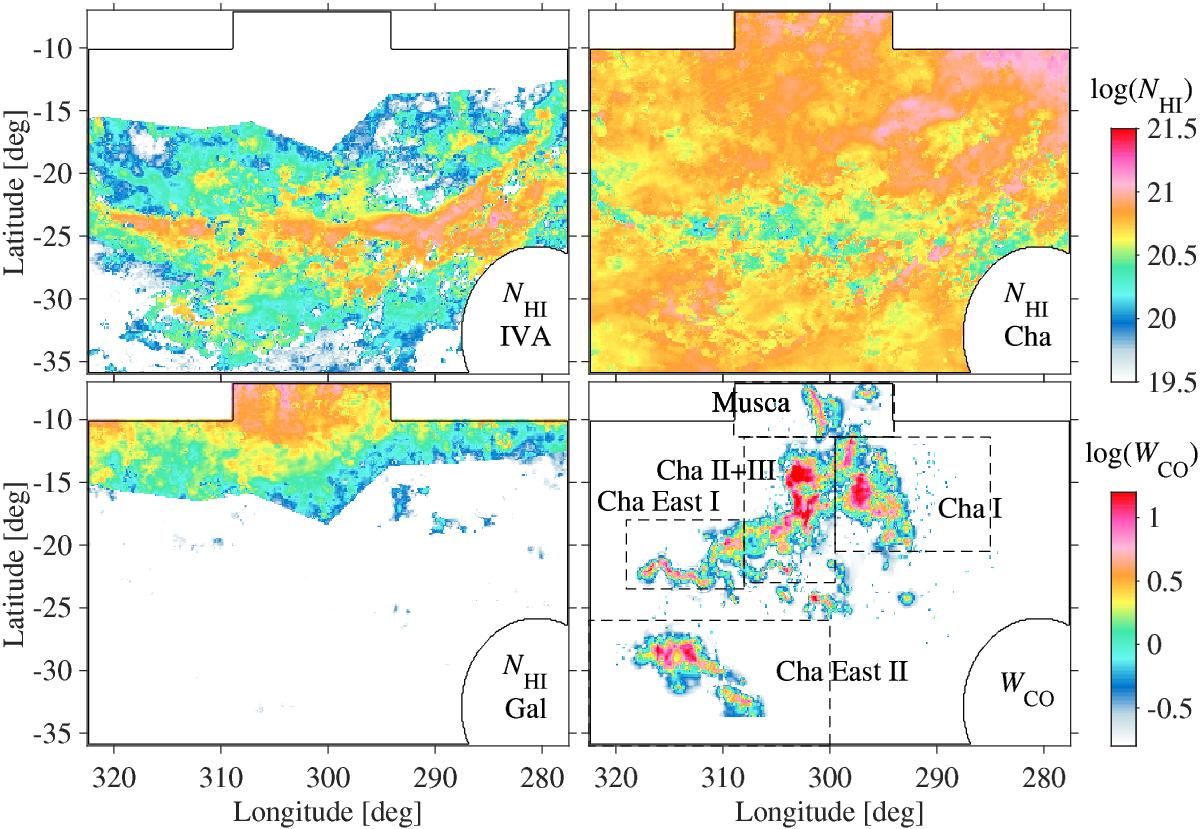
Maps of the NH i column densities (in cm-2) and WCO line intensities (in K km s-1) obtained for different velocity components in the analysis region: NH i for the intermediate velocity arc; NH i and WCO for the local Chamaeleon complex; and NH i for the Galactic disc background. The NH i column densities have been obtained for optically thin emission. The solid black contour marks the analysis region. The dashed rectangles outline the boundaries of the five substructures described in Sect. 2.5 and analysed in Sect. 10.
Current usage metrics show cumulative count of Article Views (full-text article views including HTML views, PDF and ePub downloads, according to the available data) and Abstracts Views on Vision4Press platform.
Data correspond to usage on the plateform after 2015. The current usage metrics is available 48-96 hours after online publication and is updated daily on week days.
Initial download of the metrics may take a while.