Free Access
Fig. A.1
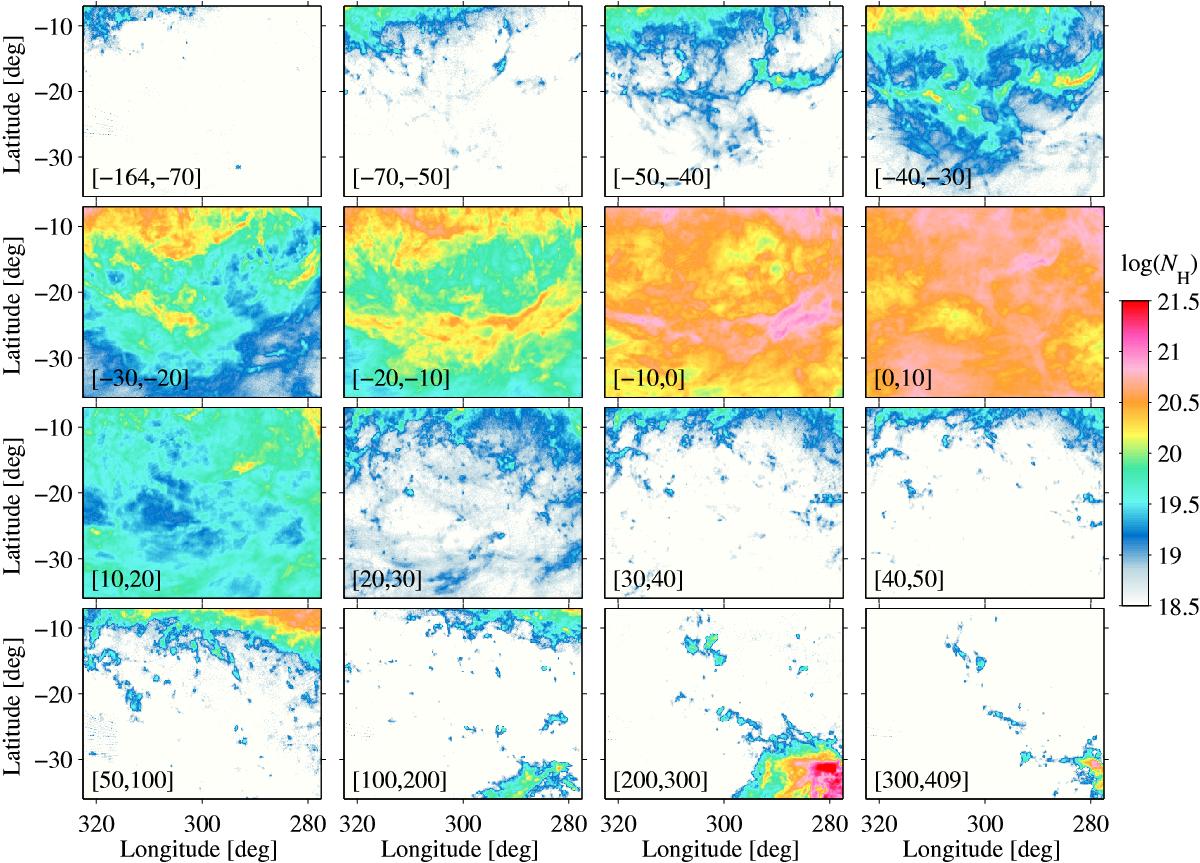
Maps of the NH i column densities (in cm-2) obtained at 14.́5, resolution from the GASS survey for optically thin emission and integrated over contiguous velocity intervals between the values given in km s-1 on the lower left corner of each map.
Current usage metrics show cumulative count of Article Views (full-text article views including HTML views, PDF and ePub downloads, according to the available data) and Abstracts Views on Vision4Press platform.
Data correspond to usage on the plateform after 2015. The current usage metrics is available 48-96 hours after online publication and is updated daily on week days.
Initial download of the metrics may take a while.