Fig. 17
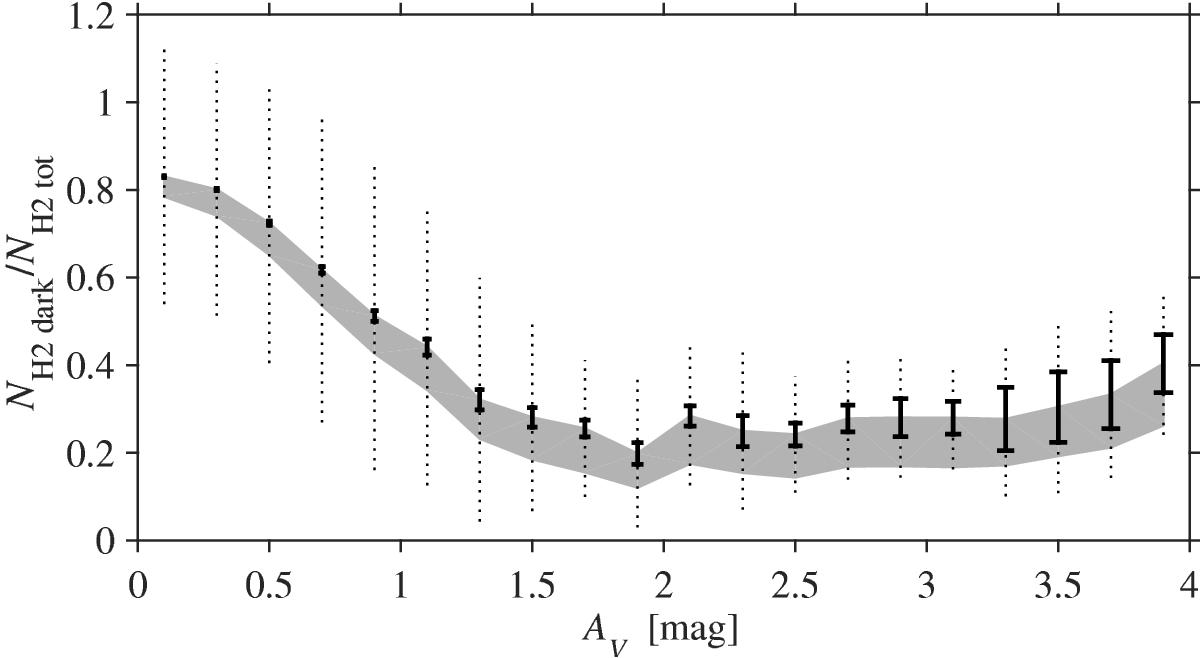
Evolution of the CO-dark to total H2 column-density ratio with the 2MASS visual extinction. The molecular fraction in the DNM varies from 50% (lower grey bound) to 100% (upper bound). The gas column densities in the CO and DNM phases have been obtained with the XCOγ factor and the γ-ray NHDNM map from the γ + AVQ analysis. The other analyses yield equivalent curves. The thick and dotted lines respectively give the standard error of the mean and the standard deviation of the ratios for each AV bin, in the case of a fully molecular DNM.
Current usage metrics show cumulative count of Article Views (full-text article views including HTML views, PDF and ePub downloads, according to the available data) and Abstracts Views on Vision4Press platform.
Data correspond to usage on the plateform after 2015. The current usage metrics is available 48-96 hours after online publication and is updated daily on week days.
Initial download of the metrics may take a while.