Fig. 16
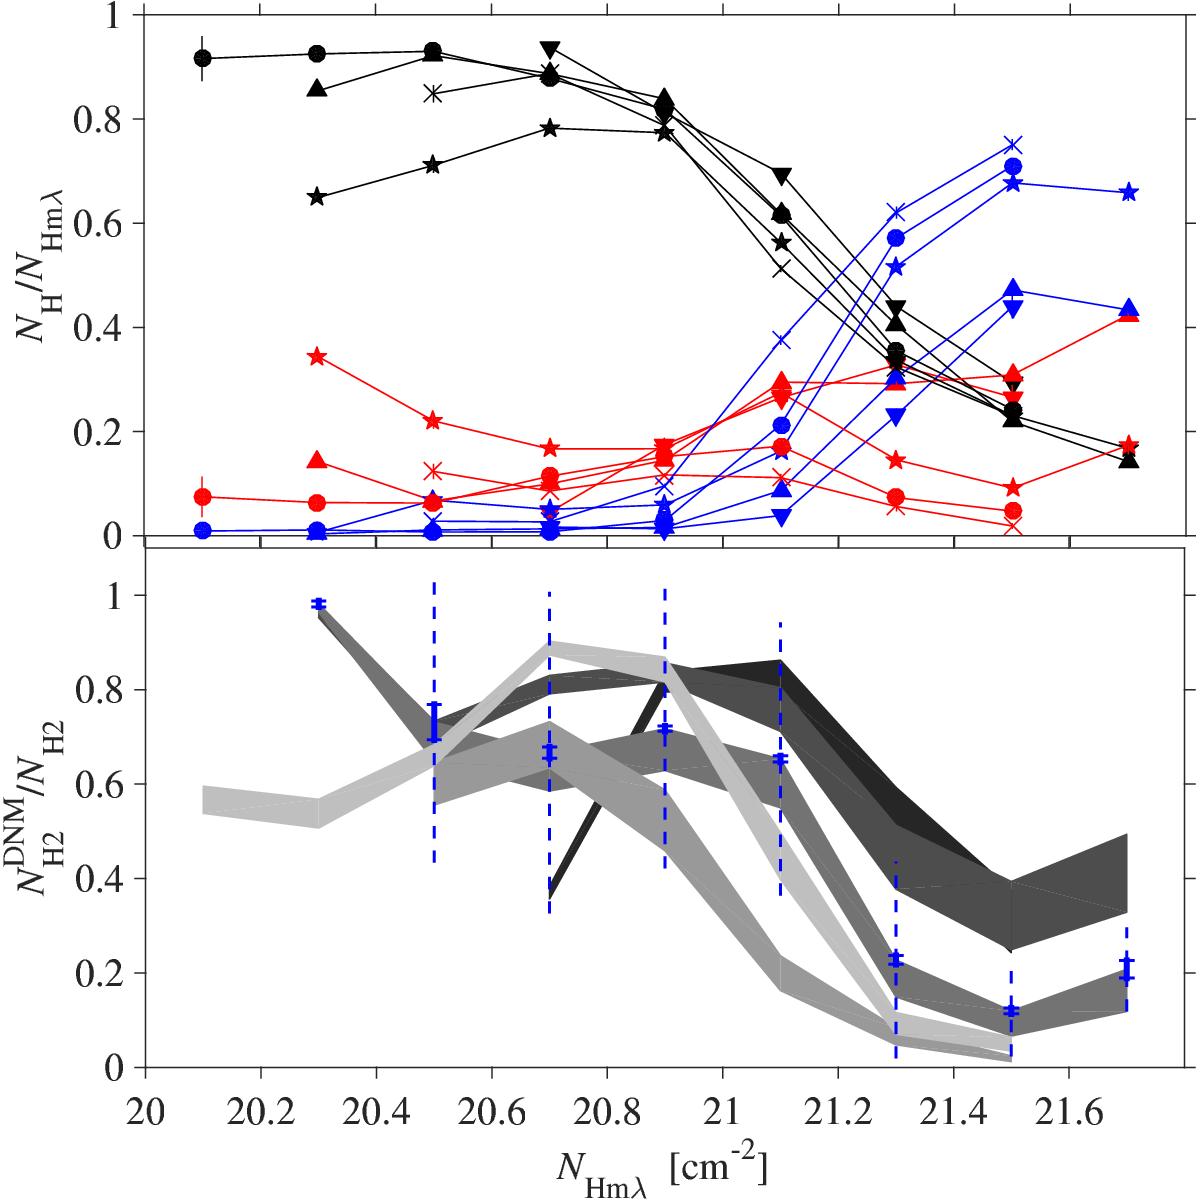
Variations with NH mλ, in five separate clouds, of the fraction of the total column density in each phase (upper panel, H i in black, DNM in red, CO in blue) and of the fraction of the total H2 column density that is CO dark (lower panel). Downward and upward triangles, stars, crosses, and circles refer to Musca, Cham I, Cham II+III, Cham East I, and Cham East II, respectively. The dark to light grey curves correspond to the clouds in the same order. The shaded areas cover the chosen uncertainty in DNM composition from 50% to 100% H2. The dotted and solid error bars give the standard deviations and errors on the mean in each NH bin; they are shown for only one cloud and the fully molecular DNM case.
Current usage metrics show cumulative count of Article Views (full-text article views including HTML views, PDF and ePub downloads, according to the available data) and Abstracts Views on Vision4Press platform.
Data correspond to usage on the plateform after 2015. The current usage metrics is available 48-96 hours after online publication and is updated daily on week days.
Initial download of the metrics may take a while.