Fig. 15
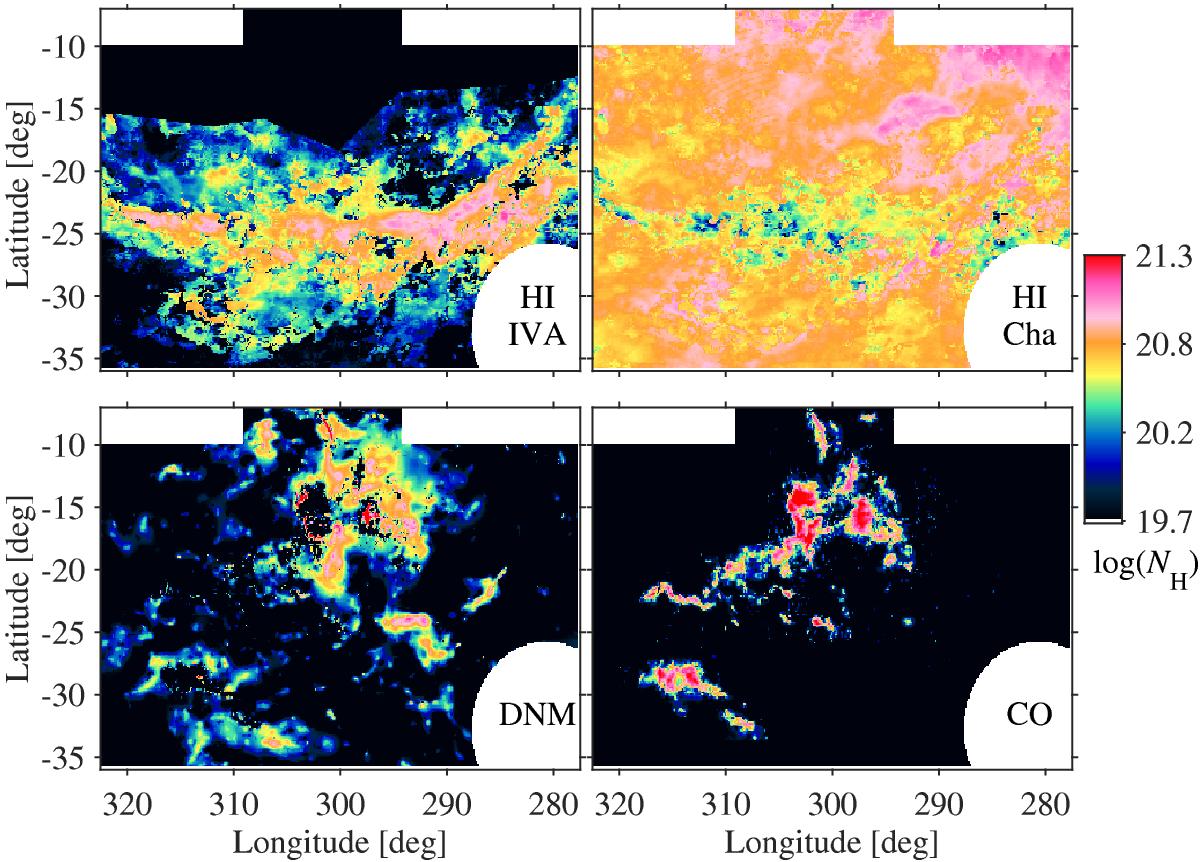
NH maps (in cm-2) for the different gas phases in the analysis region: H i in the intermediate velocity arc and, inside the Chamaeleon complex, gas in the H i, DNM, and CO-bright phases. The maps are based on the γ + AVQ analysis, with the assumption of optically thin H i, the value of XCOγ, and the dust DNM template calibrated in mass with the γ rays.
Current usage metrics show cumulative count of Article Views (full-text article views including HTML views, PDF and ePub downloads, according to the available data) and Abstracts Views on Vision4Press platform.
Data correspond to usage on the plateform after 2015. The current usage metrics is available 48-96 hours after online publication and is updated daily on week days.
Initial download of the metrics may take a while.