Fig. 12
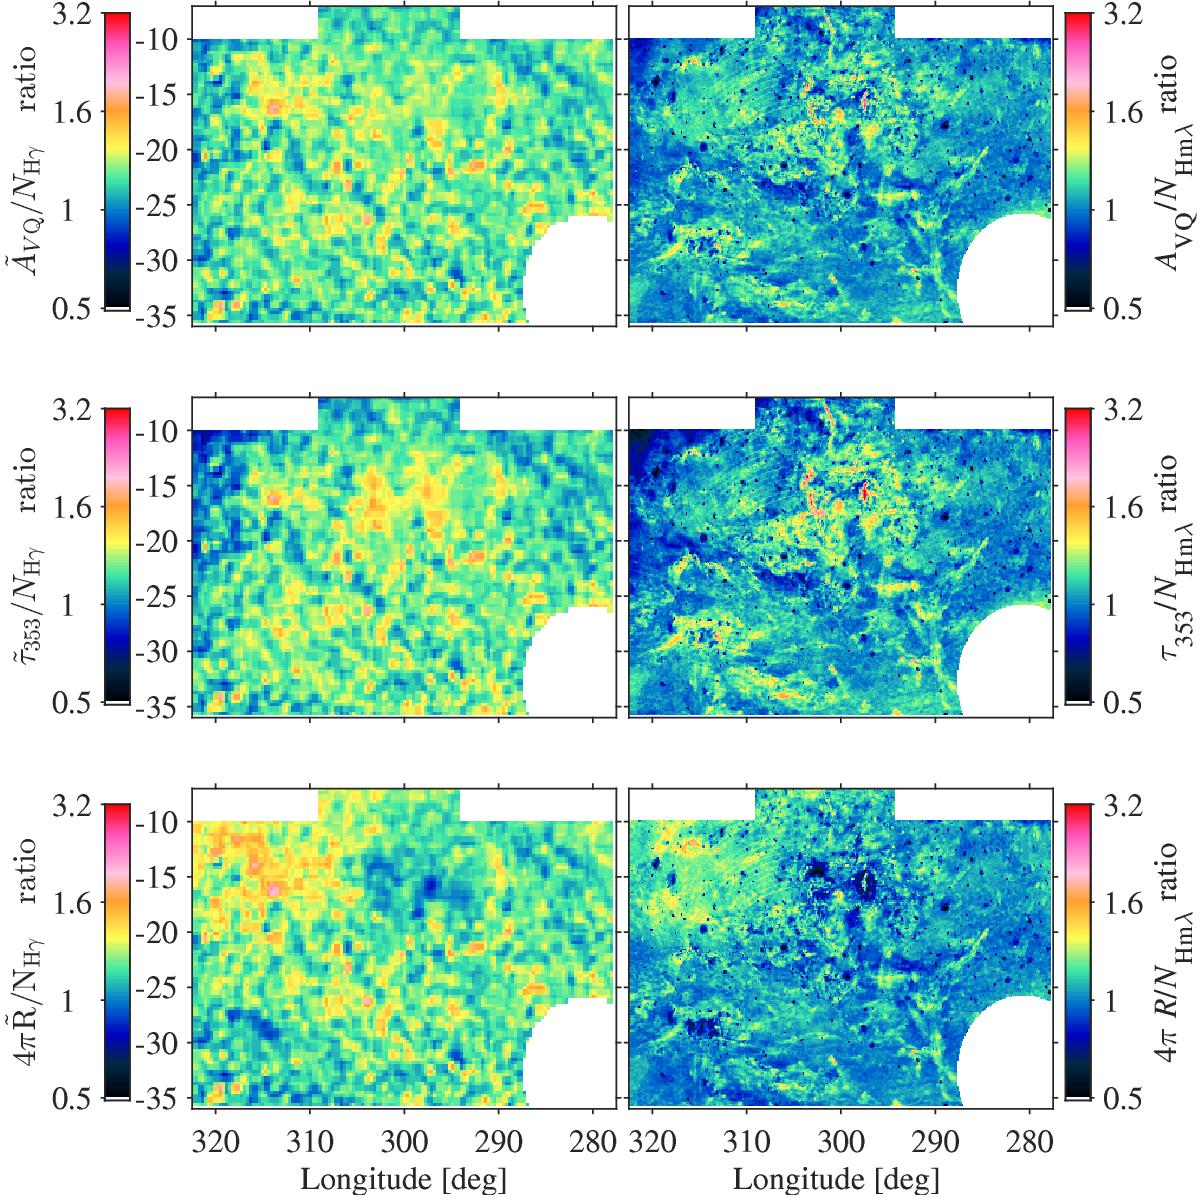
Spatial variations of the dust properties per gas nucleon, relative to the average values obtained at low NH, in the (1−2.2) × 1021 cm-2 interval for NH γ (left column), and in the (0.4−2) × 1021 cm-2 interval for NH mλ (right column). As in the previous figure, the total gas is measured by NH γ on a 0.̊375 pixel grid (left) and by NH mλ on a 0.̊125 pixel grid (right). Colours saturate for ratios below 0.5 and above 3.2.
Current usage metrics show cumulative count of Article Views (full-text article views including HTML views, PDF and ePub downloads, according to the available data) and Abstracts Views on Vision4Press platform.
Data correspond to usage on the plateform after 2015. The current usage metrics is available 48-96 hours after online publication and is updated daily on week days.
Initial download of the metrics may take a while.