Fig. 10
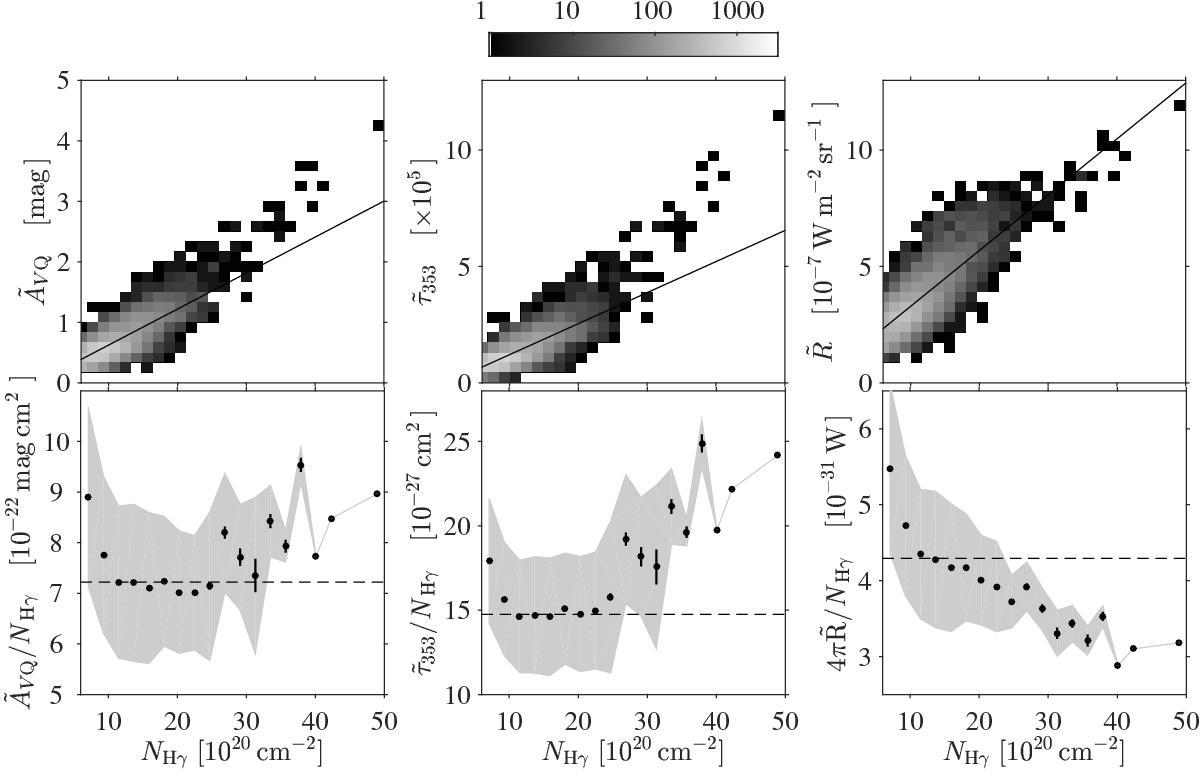
Upper row: 2D histograms of the correlations between the total gas column density, NH γ, measured by the 102.6−5 MeV interstellar γ rays, and the dust tracers convolved with the LAT response for an interstellar spectrum. The maps were sampled on a 0.̊375 pixel grid. The solid lines mark the best linear regressions through the data points of the maps. Lower row: evolution of the dust properties per gas nucleon in bins of NH γ. The error bars and shaded areas respectively give the standard error of the means and the standard deviations in each bin. The dashed lines give the mean ratios at low NH, in the (1−2.2) × 1021 cm-2 interval.
Current usage metrics show cumulative count of Article Views (full-text article views including HTML views, PDF and ePub downloads, according to the available data) and Abstracts Views on Vision4Press platform.
Data correspond to usage on the plateform after 2015. The current usage metrics is available 48-96 hours after online publication and is updated daily on week days.
Initial download of the metrics may take a while.