Fig. 1
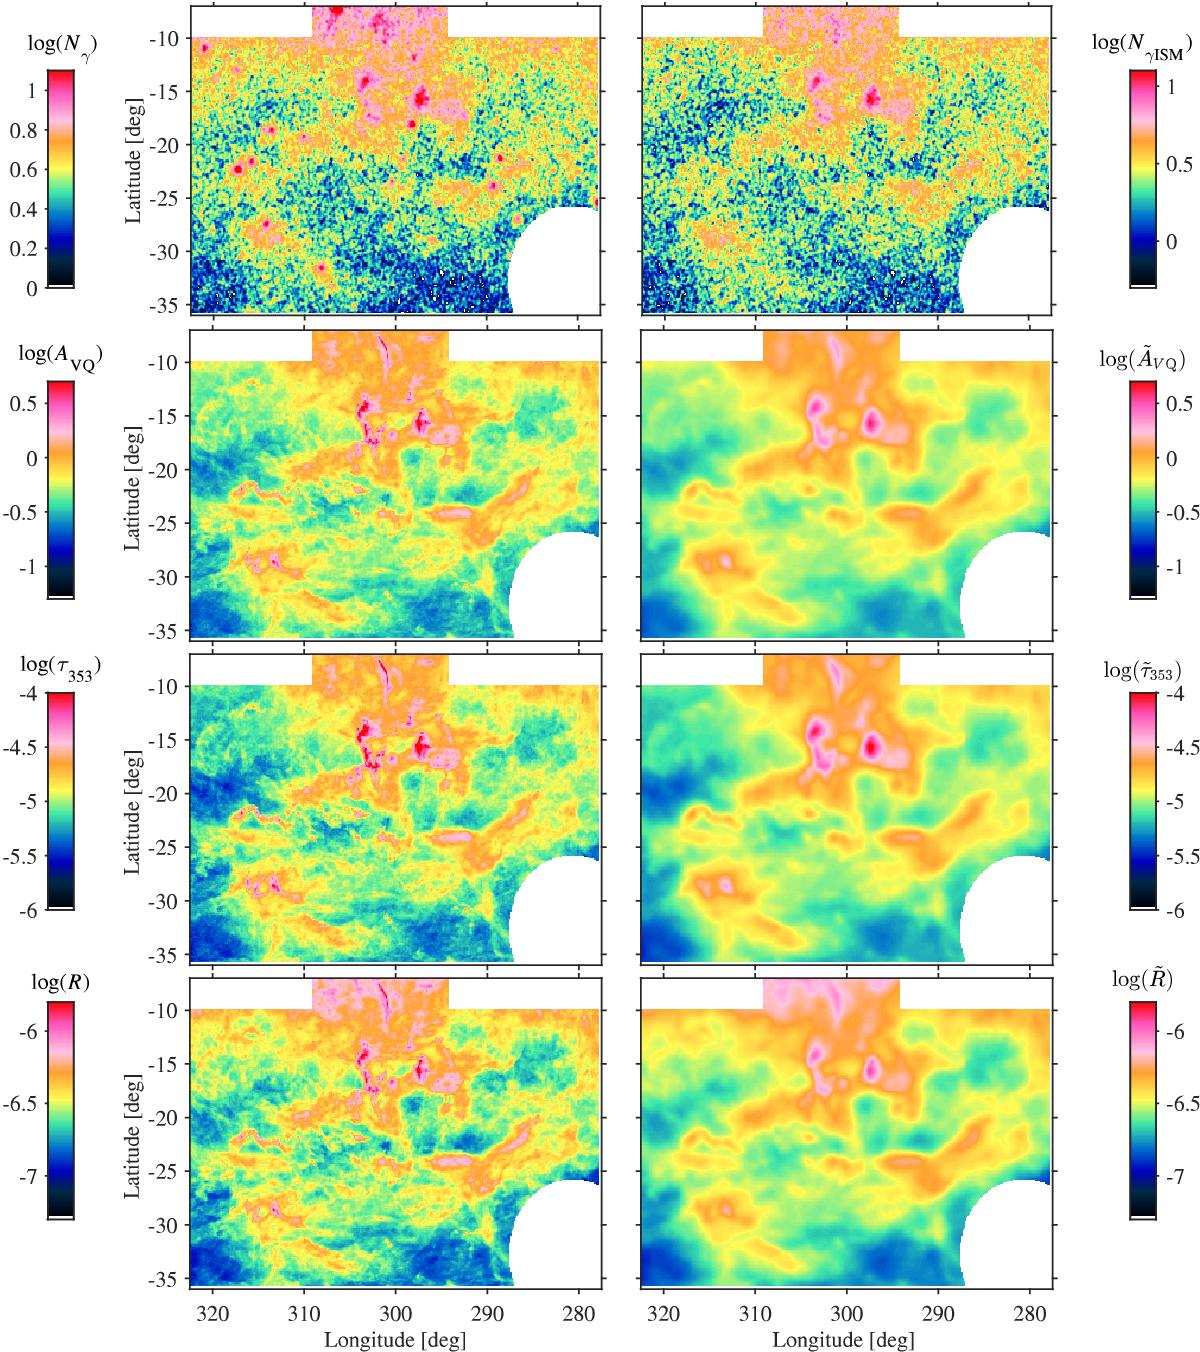
Maps toward the Chamaeleon region of the γ-ray counts recorded in the 0.4−100 GeV band and of the dust quantities (modified extinction AVQ in magnitudes, optical depth τ353, and radiance R in W m-2 sr-1). The total γ-ray photon counts are shown on the left and those spawned by cosmic-ray interactions with gas (after subtraction of other ancillary components) on the right. The γ-ray maps have been constructed on a 7.́5 pixel grid and smoothed with a Gaussian kernel of 0′.1 for display. The dust quantities are shown at 5′ resolution in the left panels, and at the Fermi LAT resolution on the right (after convolution with the energy-dependent response function of the LAT, assuming the local interstellar γ-ray spectrum over the 0.4−100 GeV band, tilded variables). Regions excluded from the analysis have been masked out.
Current usage metrics show cumulative count of Article Views (full-text article views including HTML views, PDF and ePub downloads, according to the available data) and Abstracts Views on Vision4Press platform.
Data correspond to usage on the plateform after 2015. The current usage metrics is available 48-96 hours after online publication and is updated daily on week days.
Initial download of the metrics may take a while.