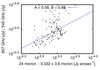
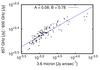
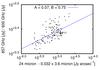
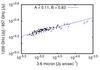
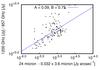
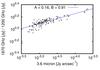
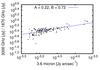
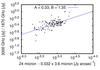
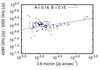
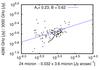
Fig. 7
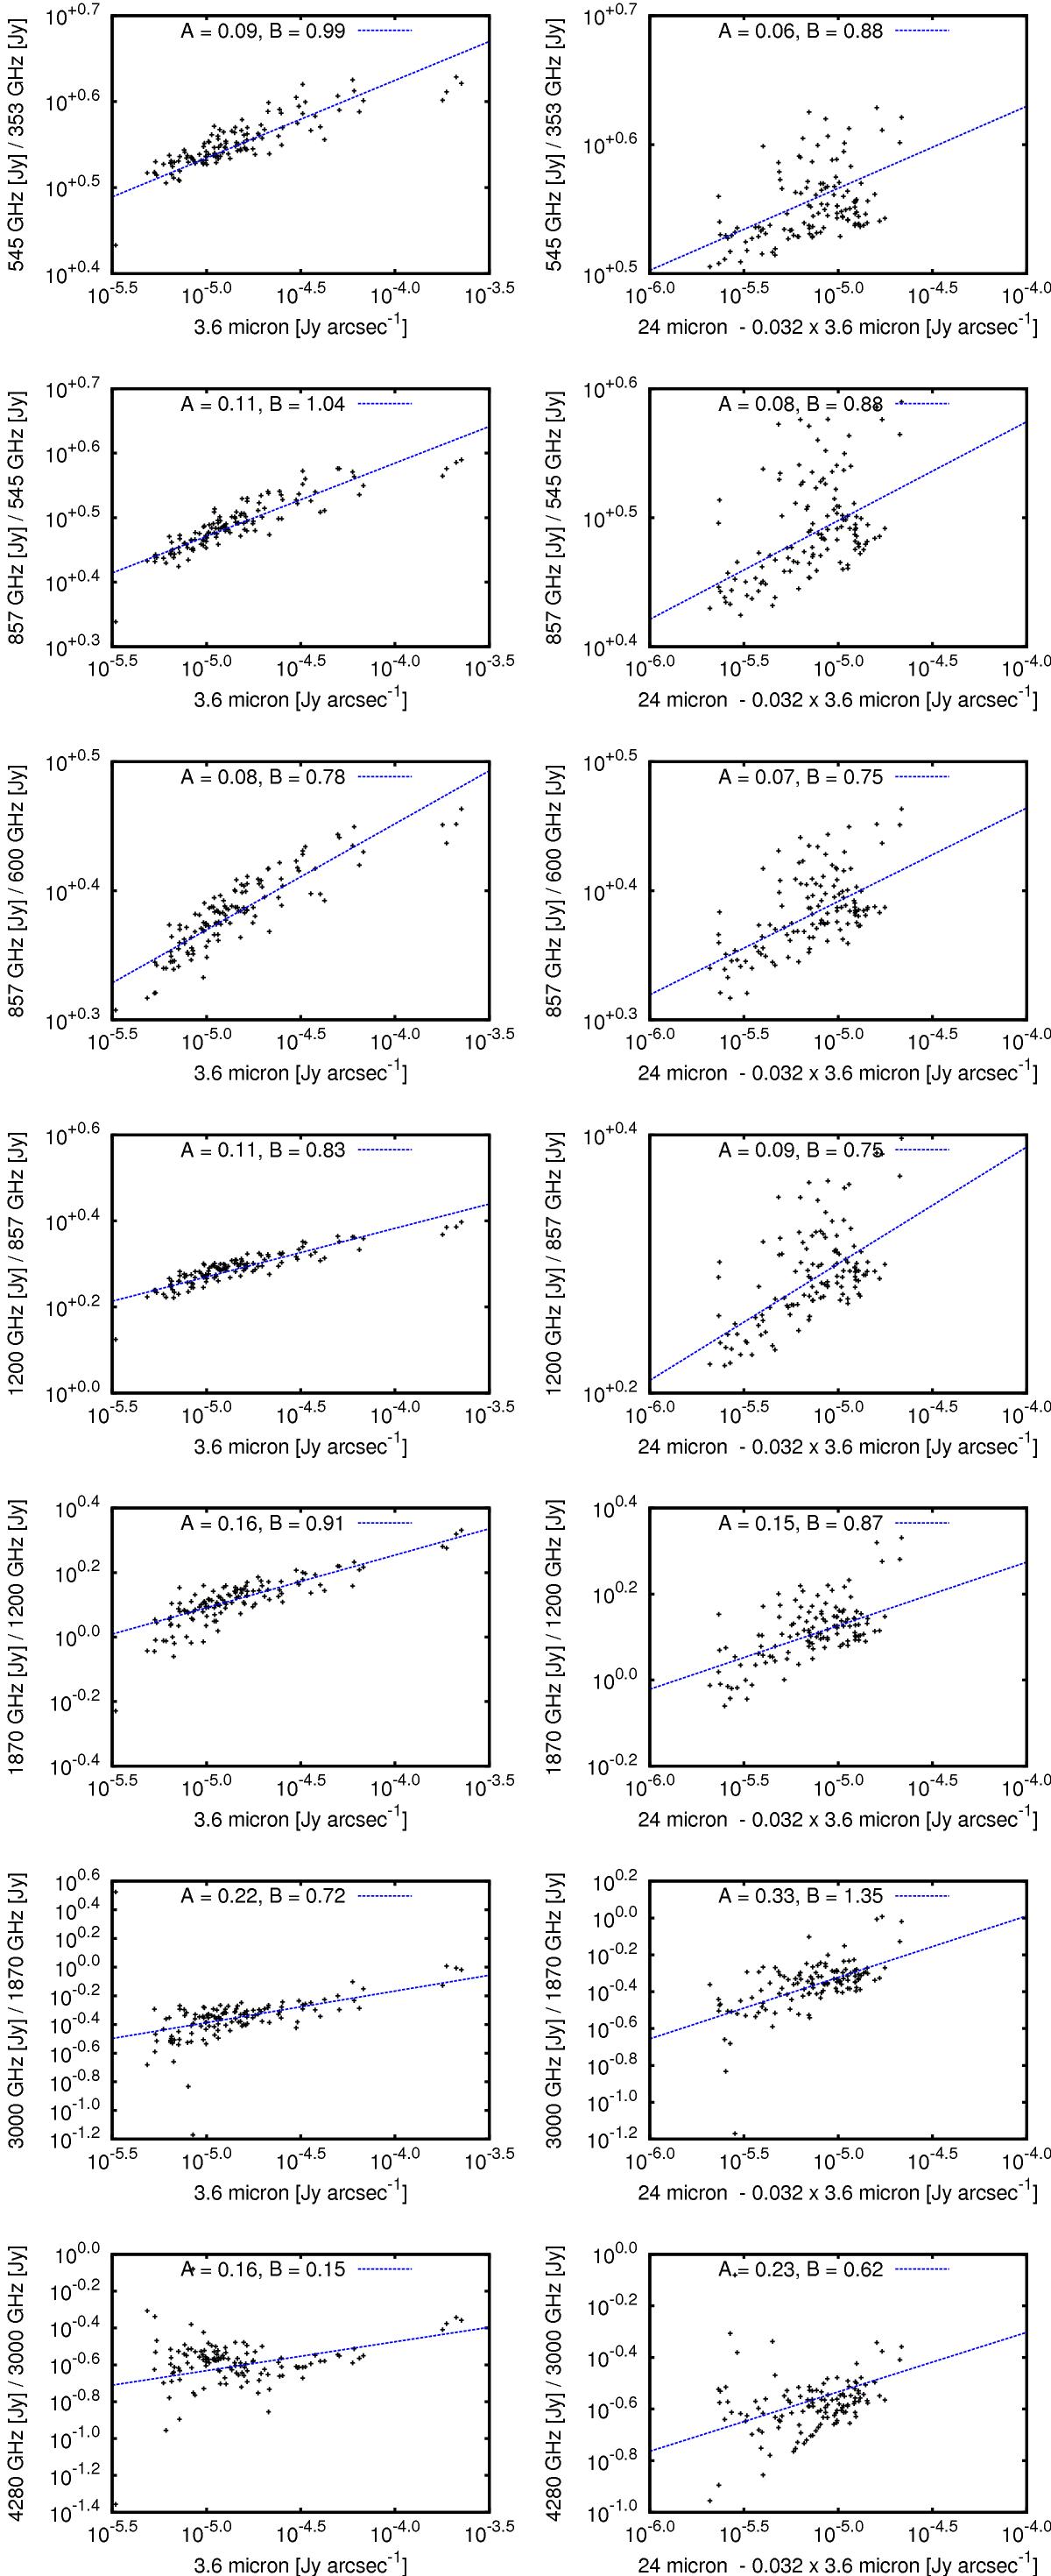
Correlations between colour ratios and 3.6 μm, tracing the stellar population (left), and 24 μm, tracing star formation regions (right). The best fits of the form log 10(y) = Alog 10(x) + B are shown by the solid lines. The correlation with 3.6 μm emission becomes less significant as the frequencies of the colour ratios increase, whilst the 24 μm correlation becomes more significant. The correlation values are given in Table 2.

Current usage metrics show cumulative count of Article Views (full-text article views including HTML views, PDF and ePub downloads, according to the available data) and Abstracts Views on Vision4Press platform.
Data correspond to usage on the plateform after 2015. The current usage metrics is available 48-96 hours after online publication and is updated daily on week days.
Initial download of the metrics may take a while.