Free Access
Fig. 5
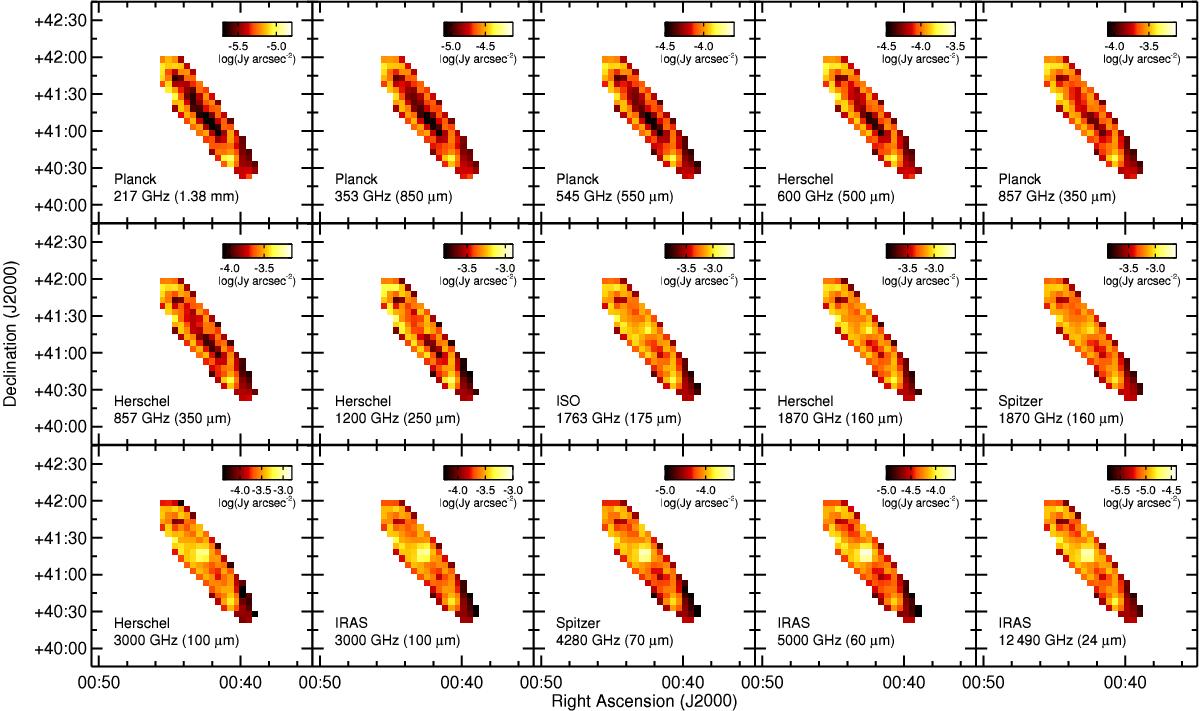
Masked and pixelized 5′ data set ordered in increasing frequency (decreasing wavelength). The maps are 3° × 3° in size. There is a clear change of morphology as frequency increases, with the rings being most prominent at the lower frequencies, and the nucleus being highlighted at higher frequencies.
Current usage metrics show cumulative count of Article Views (full-text article views including HTML views, PDF and ePub downloads, according to the available data) and Abstracts Views on Vision4Press platform.
Data correspond to usage on the plateform after 2015. The current usage metrics is available 48-96 hours after online publication and is updated daily on week days.
Initial download of the metrics may take a while.