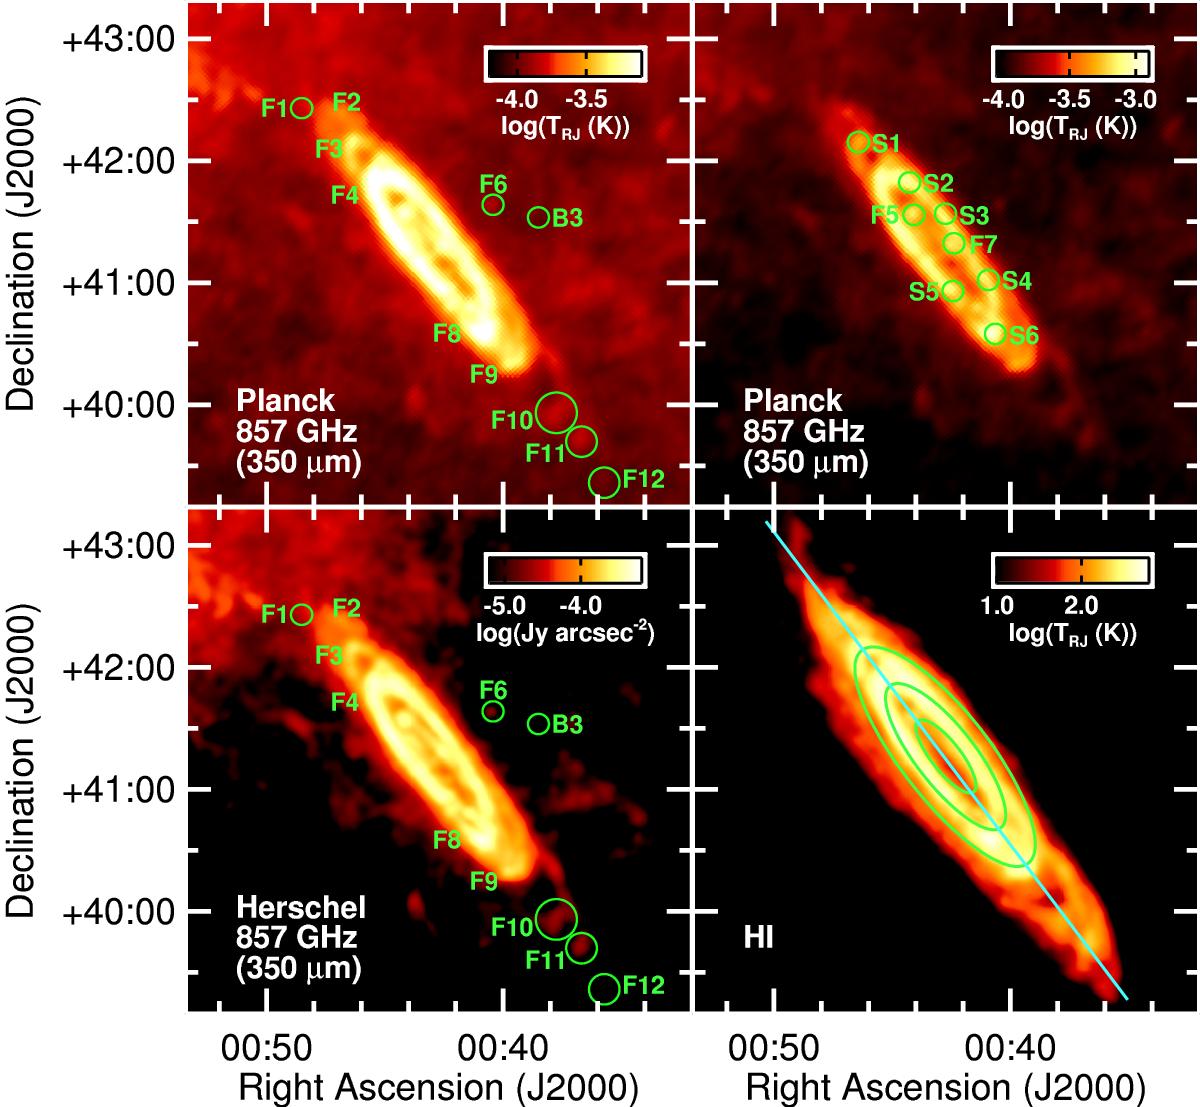
Fig. 3

Top-left: the 857 GHz (350 μm) Planck map of M 31, highlighting the extension of the dust out to large distances. Fields of interest are labelled with “F,” and circled in some cases. The position of the radio source B3 0035+413 is also shown (labeled B3). Top-right: the 857 GHz (350 μm) map, with a scale chosen to highlight the brighter emission. Circles labelled with “S” indicate the sources included in the Planck ERCSC (see Appendix B); two fields in the centre region are also labelled with “F”. Bottom-left: the 857 GHz (350 μm) Herschel map convolved to the same resolution as the Planck data, with the same fields of interest labelled as in the Planck map above. Bottom-right: a map of the H i emission from M 31 (Chemin et al. 2009) convolved to the same resolution as the Planck 857 GHz (350 μm) map, with 5, 10, and 15 kpc rings overlaid in green, and the cut used in Fig. 4 in blue.
Current usage metrics show cumulative count of Article Views (full-text article views including HTML views, PDF and ePub downloads, according to the available data) and Abstracts Views on Vision4Press platform.
Data correspond to usage on the plateform after 2015. The current usage metrics is available 48-96 hours after online publication and is updated daily on week days.
Initial download of the metrics may take a while.


