Fig. 2
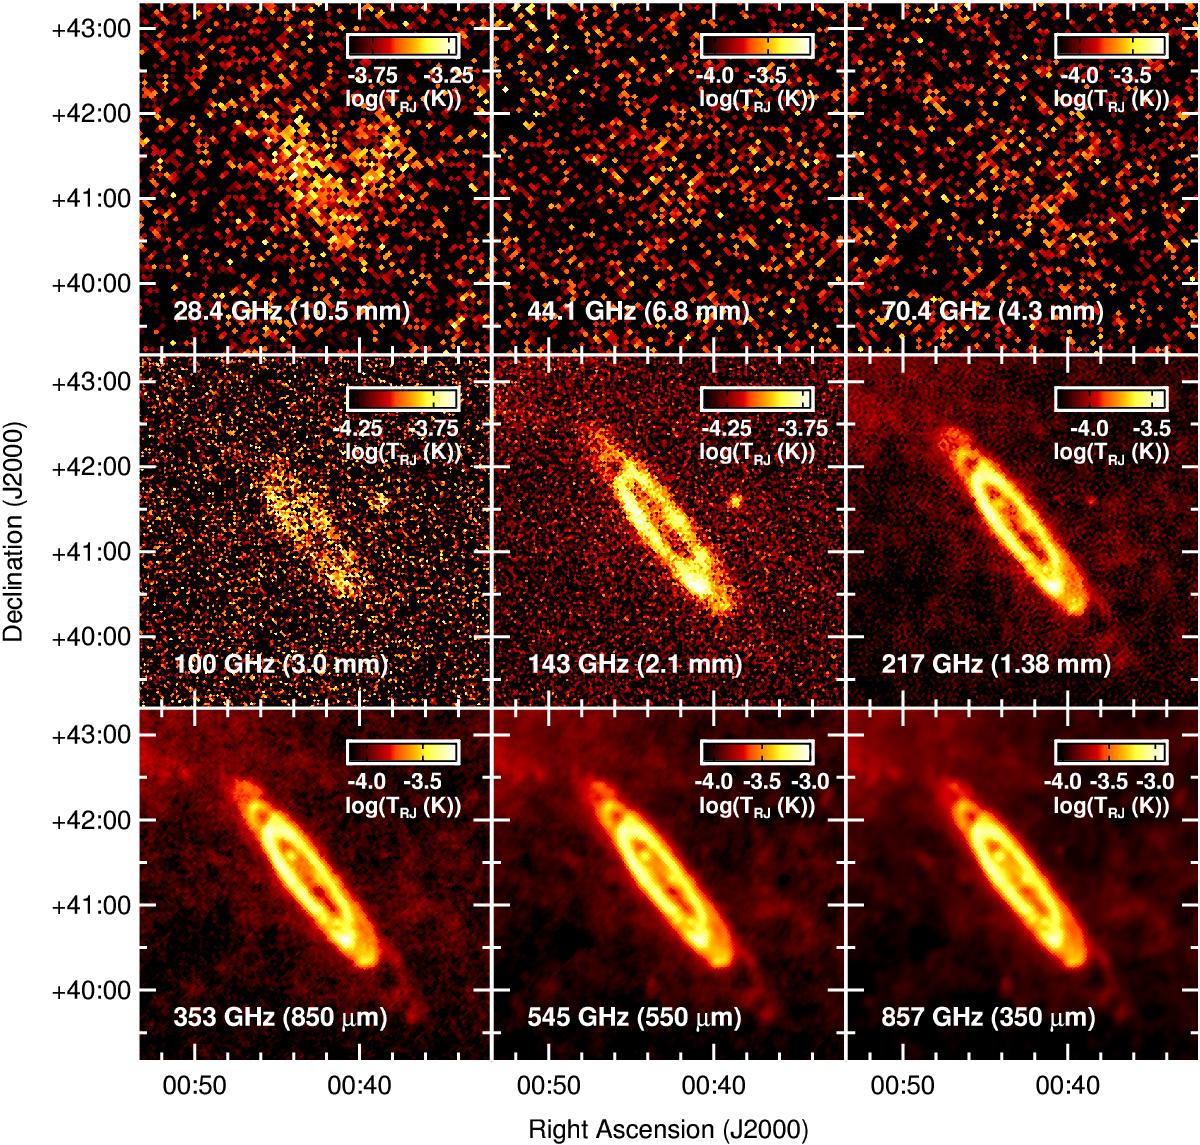
Maps of M 31 in total intensity from Planck (after CMB subtraction). Top to bottom, left to right: Planck 28.4, 44.1, and 70.4 GHz; Planck 100, 143, and 217 GHz; Planck 353, 545, and 857 GHz. All plots have units of Kelvin (TRJ), have a 1° equatorial graticule overlaid, are 250′ × 250′ with 0.5′ × 0.5′ pixels and are centred on RA 10.̊68, Dec 41.̊27, with north up and east to the left.
Current usage metrics show cumulative count of Article Views (full-text article views including HTML views, PDF and ePub downloads, according to the available data) and Abstracts Views on Vision4Press platform.
Data correspond to usage on the plateform after 2015. The current usage metrics is available 48-96 hours after online publication and is updated daily on week days.
Initial download of the metrics may take a while.