Fig. 15
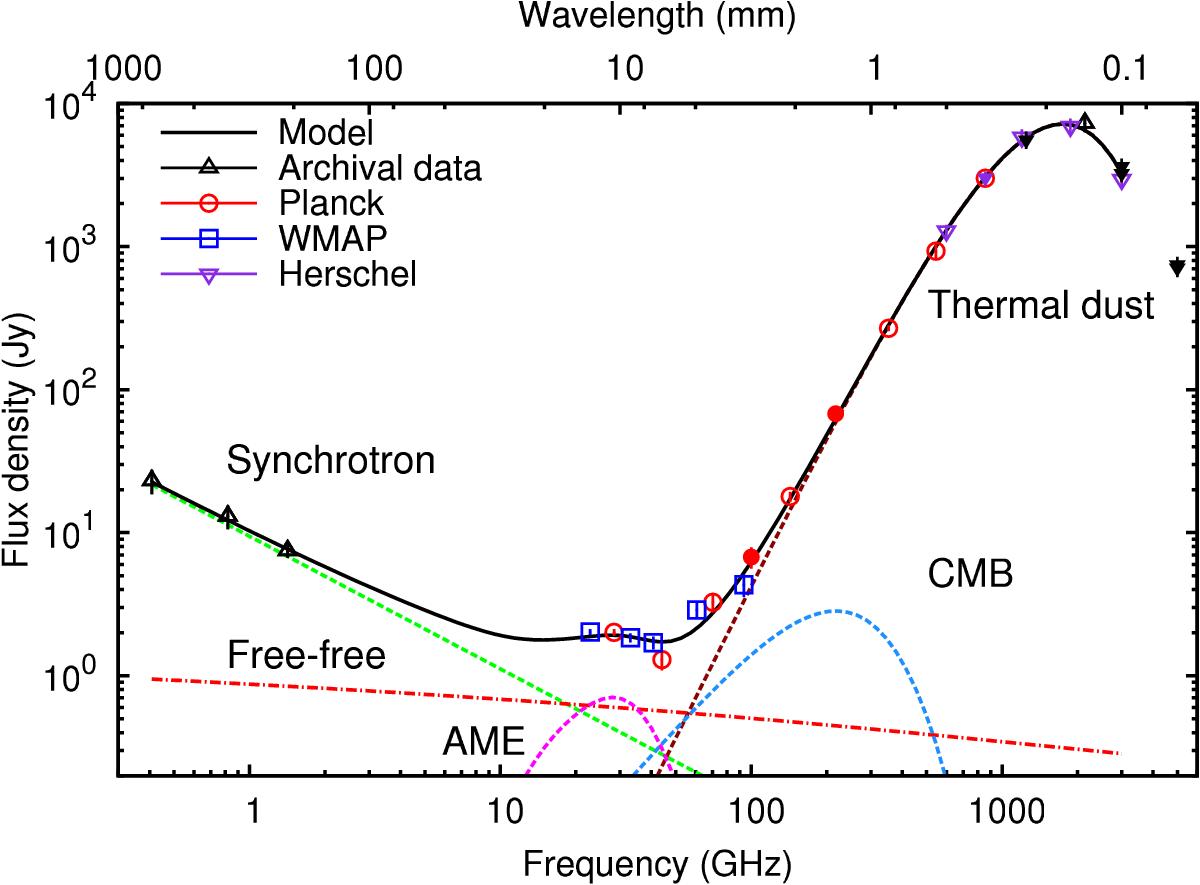
The integrated SED from radio to far-infrared, with the best-fit model from Bayesian analysis (see Sect. 7). Data points are from WMAP (blue), Planck (red), Herschel (purple) and other archival data (black). Filled points represent data that were not included in the fit. The best fit is shown in black; the green line shows the synchrotron fit, the red line shows the free-free emission, the magenta curve shown the AME, the dark red line shows the thermal dust, and the light blue line shows the CMB.
Current usage metrics show cumulative count of Article Views (full-text article views including HTML views, PDF and ePub downloads, according to the available data) and Abstracts Views on Vision4Press platform.
Data correspond to usage on the plateform after 2015. The current usage metrics is available 48-96 hours after online publication and is updated daily on week days.
Initial download of the metrics may take a while.