Fig. 12
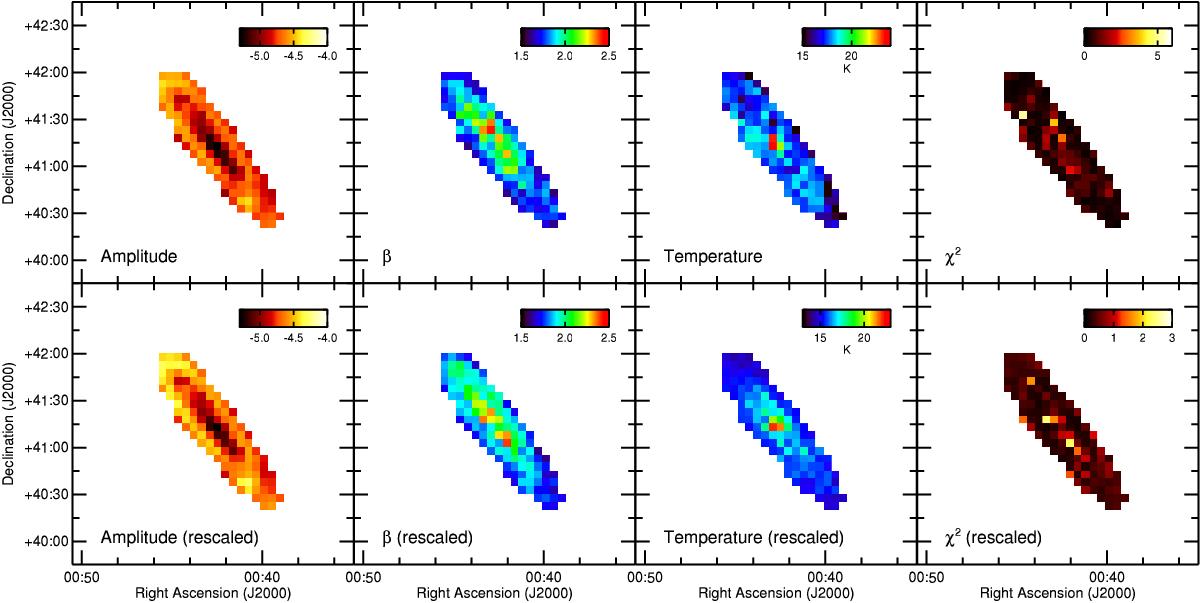
Results from allowing βdust to vary. Top: fitting for the entire SED. Bottom: fitting to the rescaled SED (i.e., only the dust component that is heated by the stellar population). Left to right: the fitted dust optical depth, spectral index, temperature, and reduced χ2. Note the difference in morphology for the dust temperature and indices.
Current usage metrics show cumulative count of Article Views (full-text article views including HTML views, PDF and ePub downloads, according to the available data) and Abstracts Views on Vision4Press platform.
Data correspond to usage on the plateform after 2015. The current usage metrics is available 48-96 hours after online publication and is updated daily on week days.
Initial download of the metrics may take a while.