Fig. 11
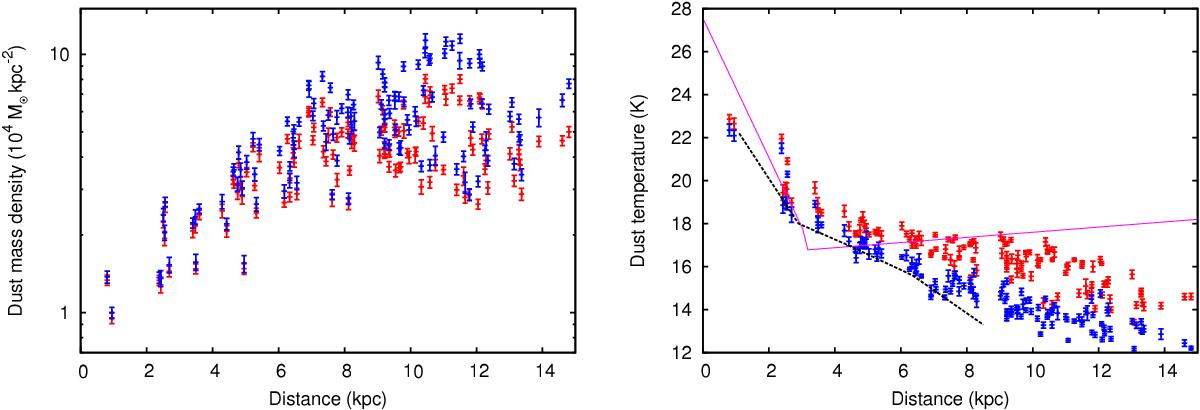
The fitted dust mass surface density (left) and dust temperature (right) as a function of galactocentric distance. Red points are from fitting the entire SED, while blue points are fitting to the fraction of the flux density that can be attributed to the dust heated by the global stellar population. Temperatures from Fritz et al. (2012) and Smith et al. (2012) are shown by the dashed black line and the solid magenta line, respectively; these differ from the analysis here due to the different dust models used and whether the dust spectral index has been allowed to vary or not. There is a systematic shift towards lower dust temperatures and higher dust masses with the rescaled SEDs.
Current usage metrics show cumulative count of Article Views (full-text article views including HTML views, PDF and ePub downloads, according to the available data) and Abstracts Views on Vision4Press platform.
Data correspond to usage on the plateform after 2015. The current usage metrics is available 48-96 hours after online publication and is updated daily on week days.
Initial download of the metrics may take a while.