Fig. 7
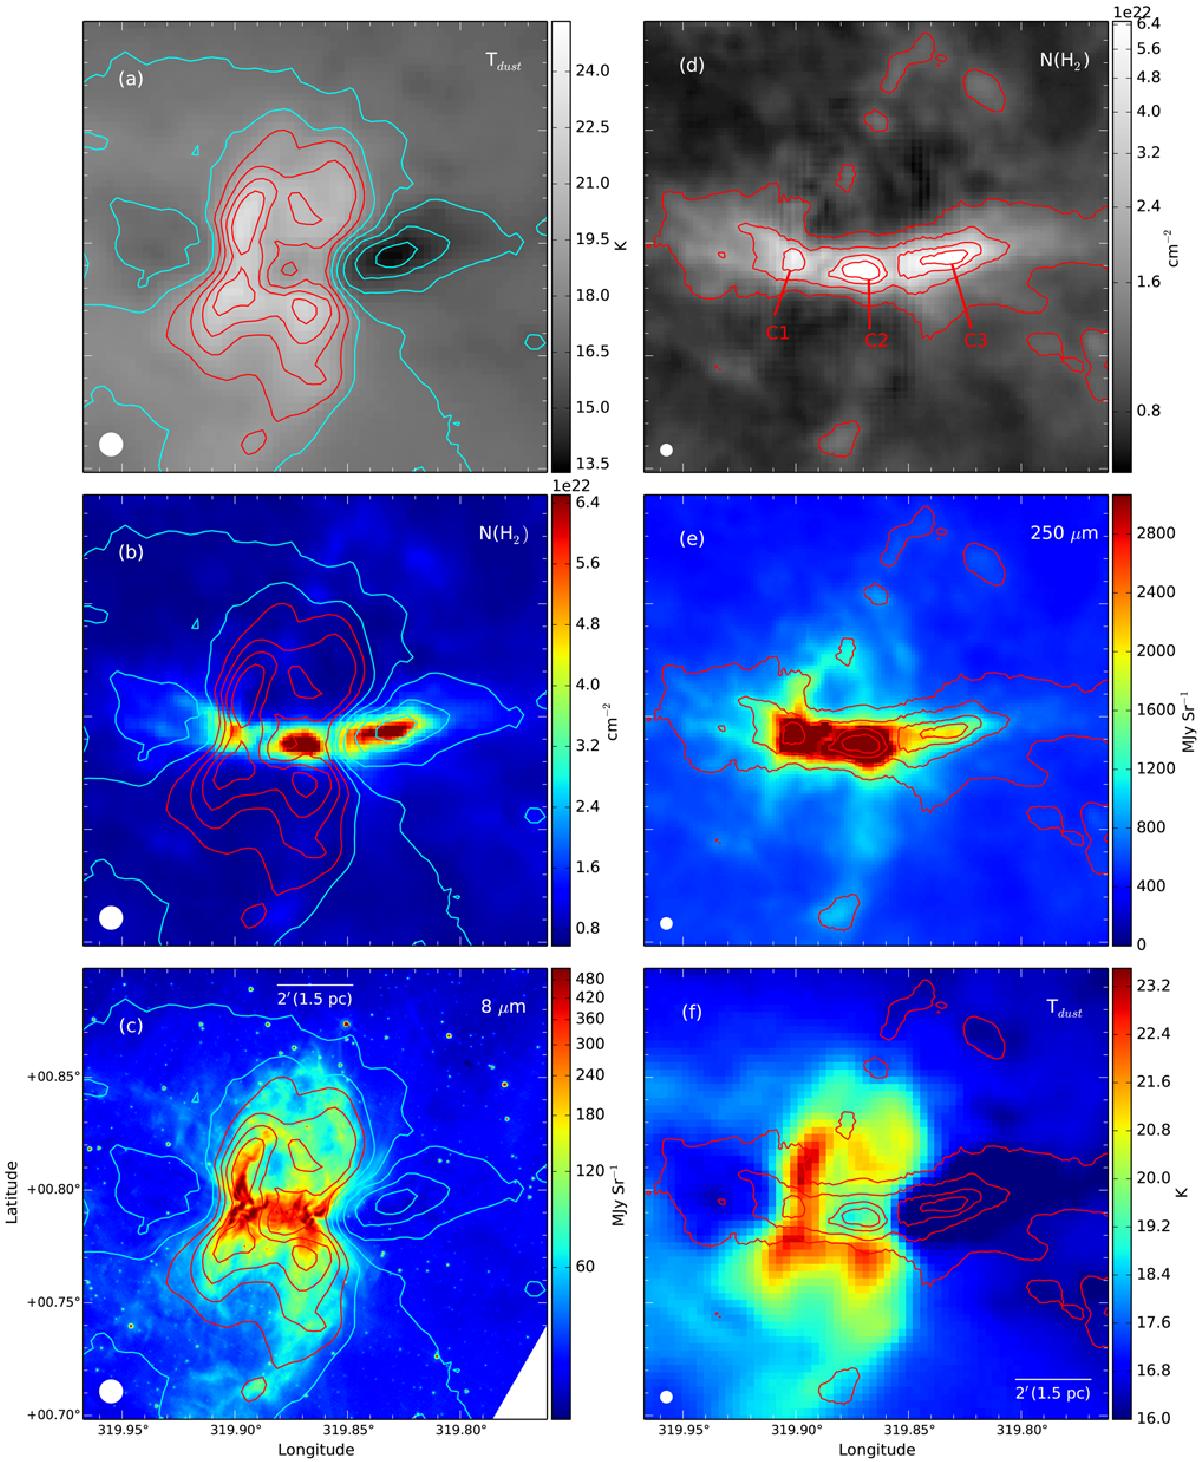
Temperature and column density maps of G319.88+00.79. The left side of the figure concerns the dust temperature. a) The underlying grey image is the temperature map; the red contours correspond to temperatures of 19, 20, 21, and 22 K; the blue ones to temperatures of 14, 15, 16, 17, and 18 K. The 36″ beam of the temperature map (also that of the 500 μm map) is at the lower left. b) The underlying image is the column density map in false colours, showing the cold parental filament. c) The underlying image is the 8.0 μm emission map in false colours, showing the bipolar lobes. The right side of the figure shows the column density. d) The underlying grey image is the column density map; the red contours correspond to column densities of 1, 2, 4, and 6 times 1022 cm-2. The 18″ beam of the column density map (also that of the 250 μm map) is at the lower left. The three clumps discussed in the text are identified. e) The underlying image is the 250 μm emission map in false colours. f) The underlying image is the temperature map in false colours.
Current usage metrics show cumulative count of Article Views (full-text article views including HTML views, PDF and ePub downloads, according to the available data) and Abstracts Views on Vision4Press platform.
Data correspond to usage on the plateform after 2015. The current usage metrics is available 48-96 hours after online publication and is updated daily on week days.
Initial download of the metrics may take a while.