Fig. 3
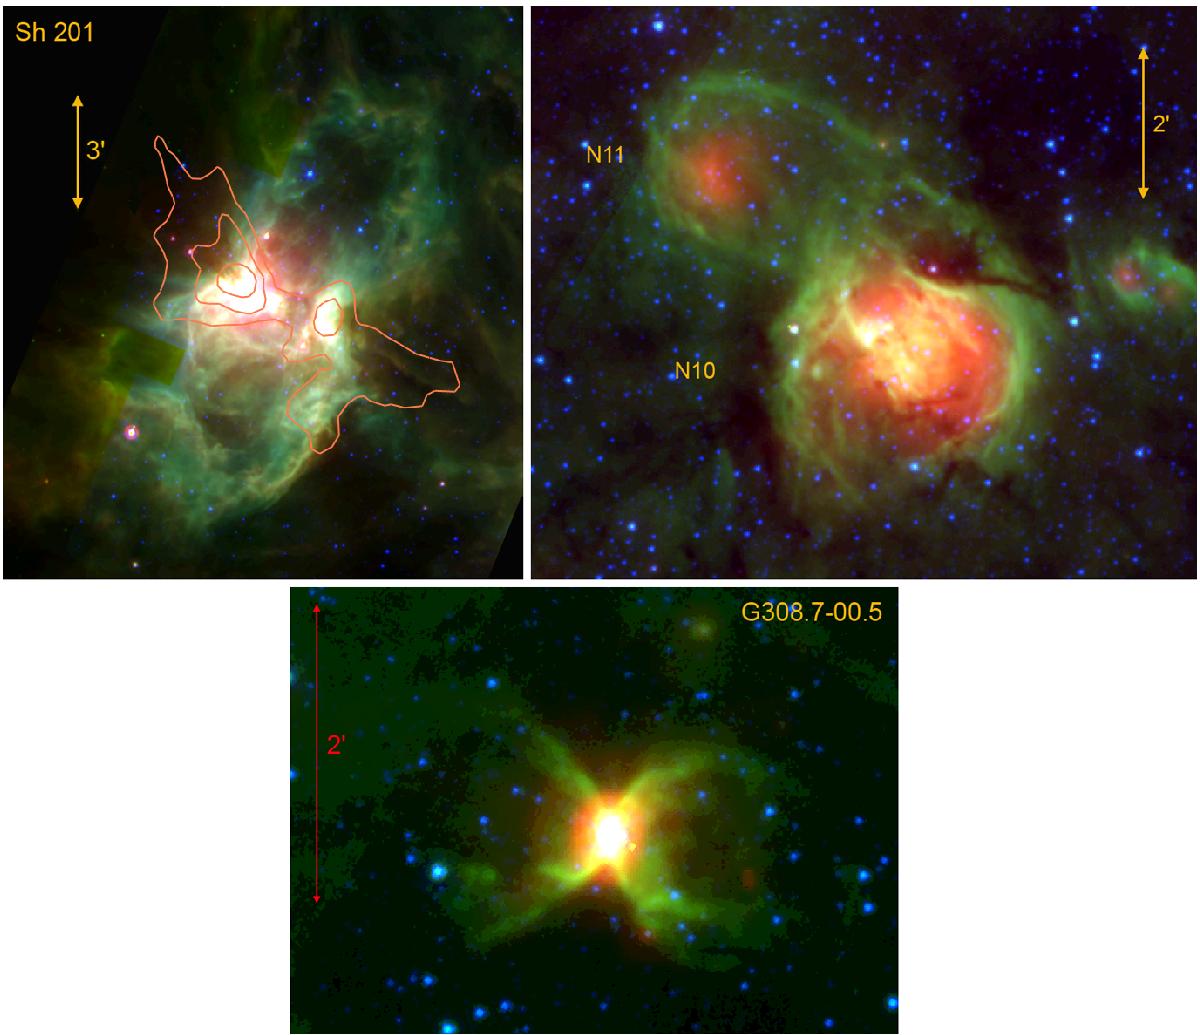
Composite colour image of H ii regions, as seen by Spitzer. Red is the MIPSGAL image at 24 μm showing the emission of the hot dust, green is the GLIMPSE image at 8.0 μm dominated by the PAHs emission from the PDRs, and blue is the GLIMPSE image at 4.5 μm showing the stellar sources. Sh 201 is a textbook example of a bipolar H ii region; the red column density contours trace the parental molecular filament (levels of 2, 5, and 15 × 1022 cm-2). N10 and N11 are adjacent bubbles around distinct H ii regions. This is a case of mis-identified bipolar nebula. G308.7-00.5 is a nebula associated with an evolved star.
Current usage metrics show cumulative count of Article Views (full-text article views including HTML views, PDF and ePub downloads, according to the available data) and Abstracts Views on Vision4Press platform.
Data correspond to usage on the plateform after 2015. The current usage metrics is available 48-96 hours after online publication and is updated daily on week days.
Initial download of the metrics may take a while.