Fig. 23
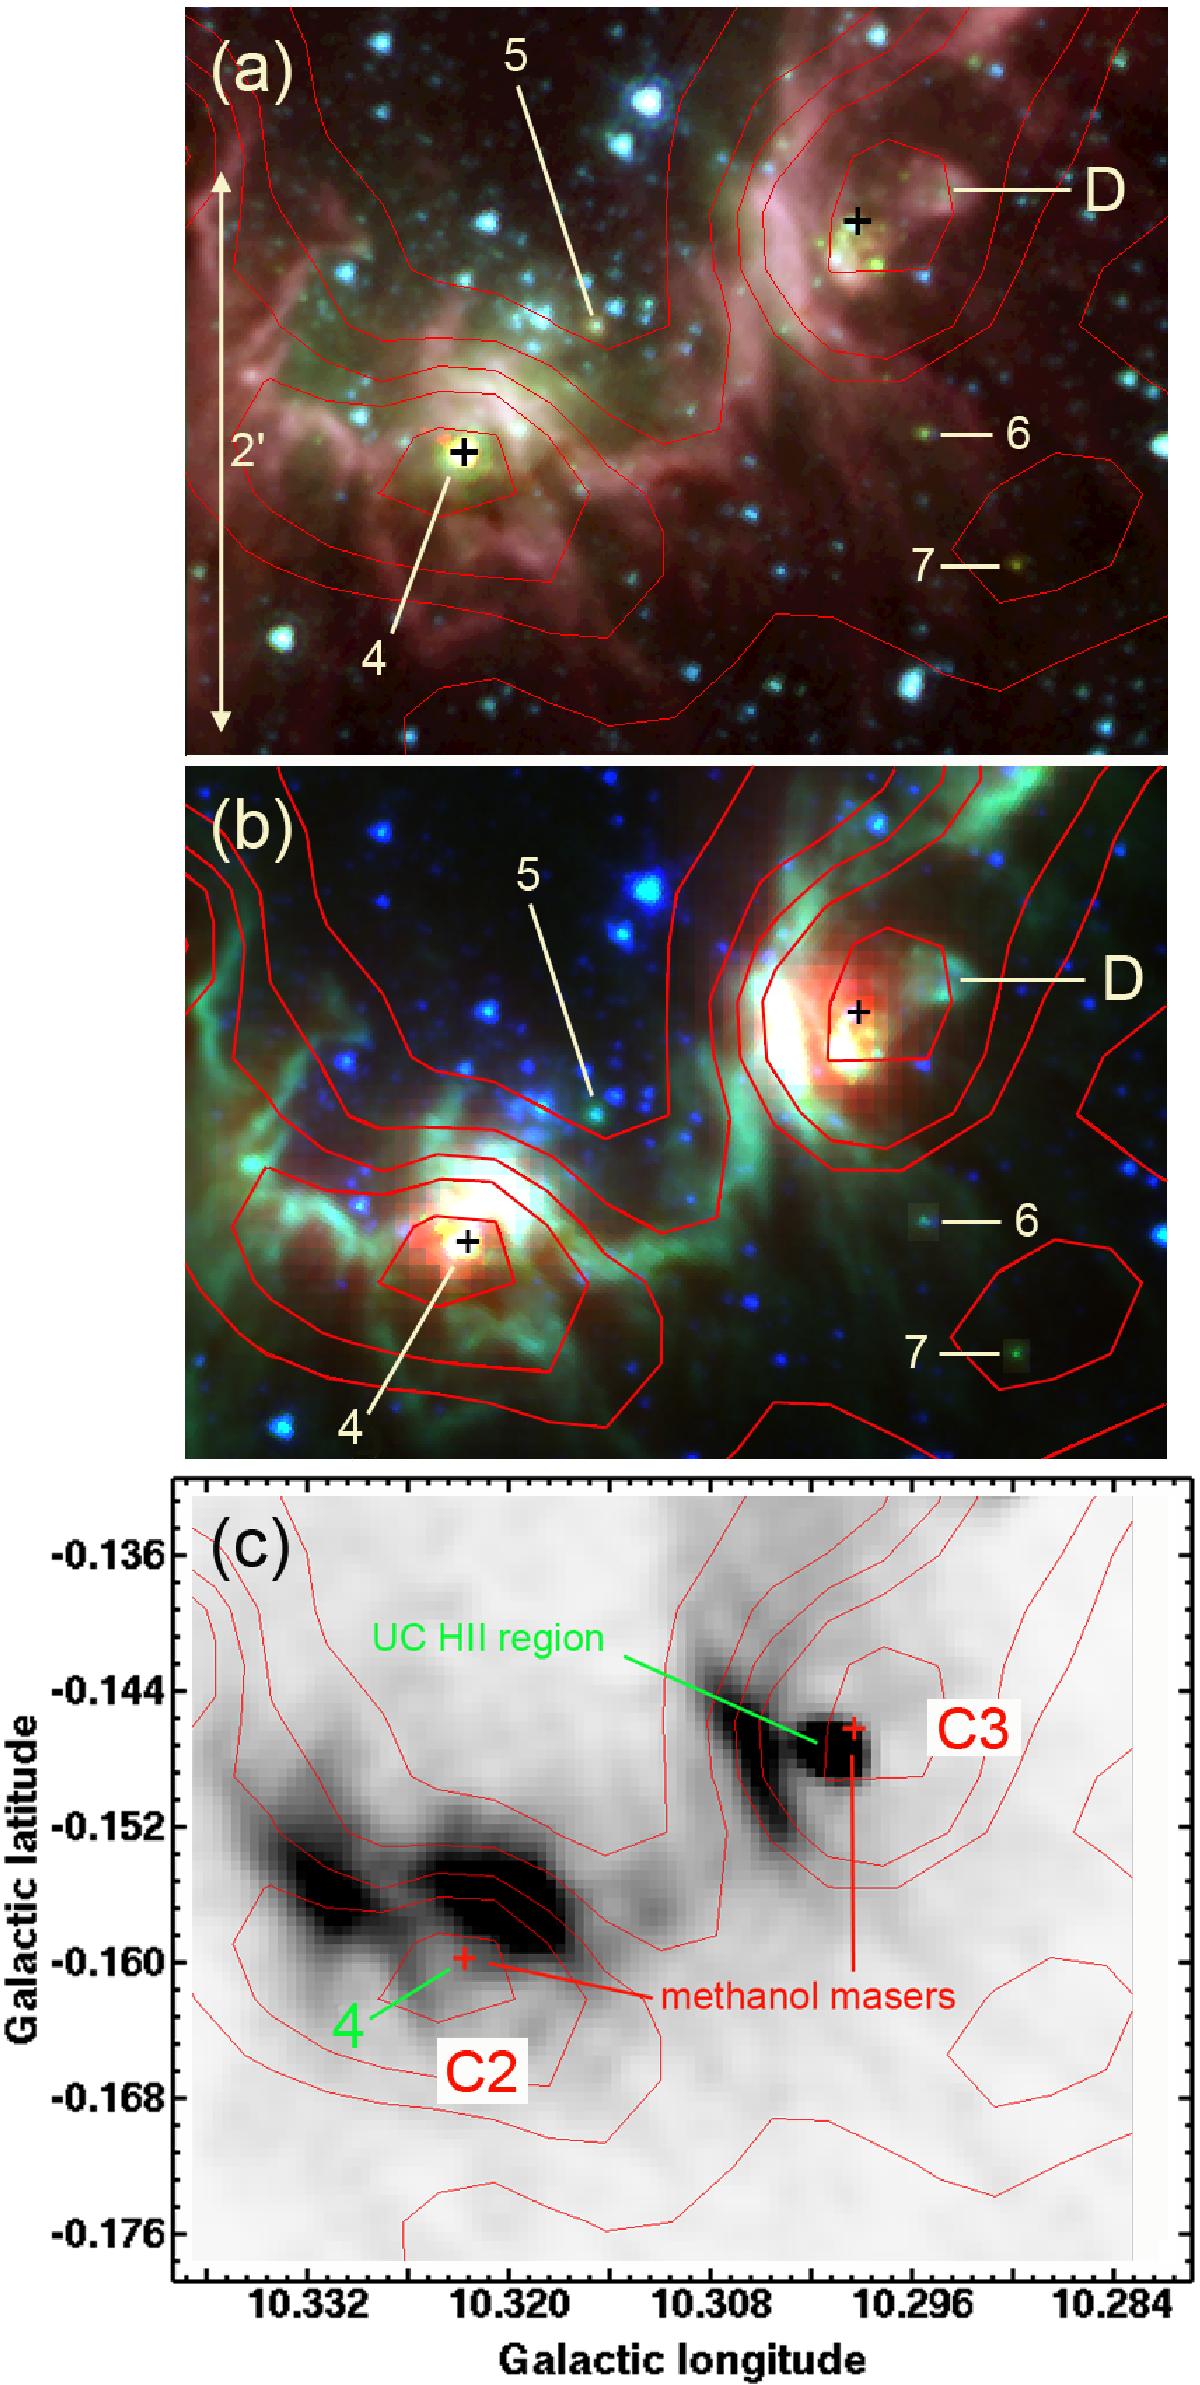
Clumps C2 and C3. a) Colour image with the Spitzer 5.8, 4.5, and 3.6 μm emissions in red, green, and blue, respectively (logarithmic units). The red contours are the column density contours (same levels as in Fig. 21b). The candidate Class I YSOs #4, #5, #6, and #7 are identified. The positions of the methanol masers are indicated by plusses. b) Colour image with the 70 μm, 5.8 μm, and 3.6 μm respectively in red, green and blue (linear units). c) The red column density contours are superimposed on the MAGPIS radio-continuum image. The UC H ii region is identified.
Current usage metrics show cumulative count of Article Views (full-text article views including HTML views, PDF and ePub downloads, according to the available data) and Abstracts Views on Vision4Press platform.
Data correspond to usage on the plateform after 2015. The current usage metrics is available 48-96 hours after online publication and is updated daily on week days.
Initial download of the metrics may take a while.