Fig. 20
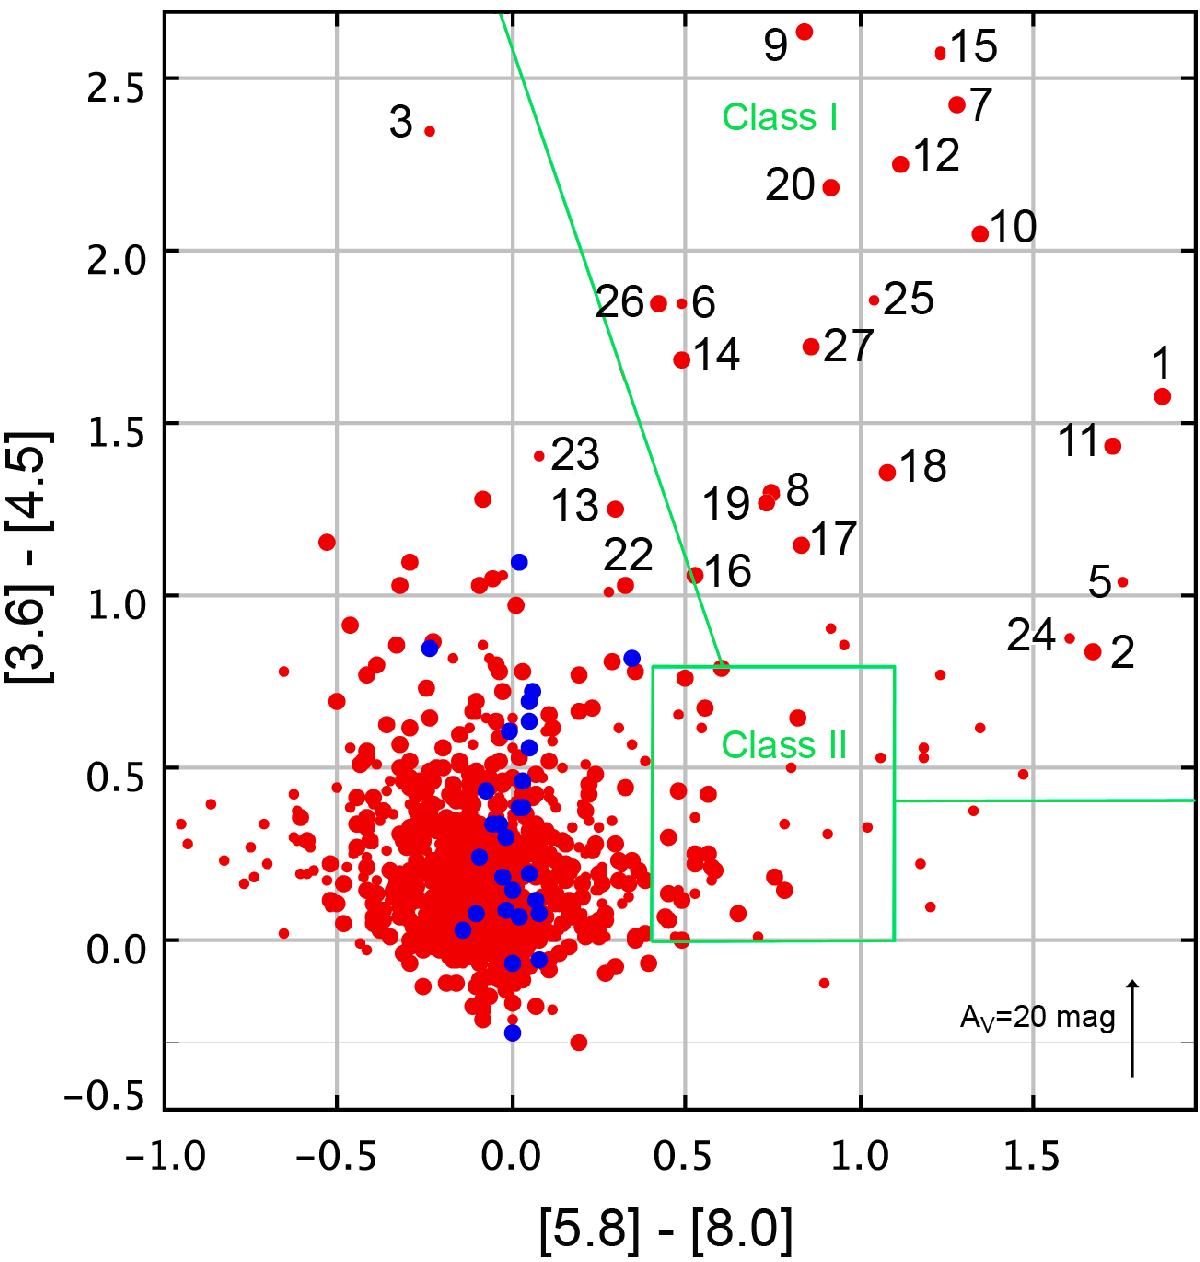
Colour–colour diagram, [3.6]−[4.5] versus [5.8]−[8.0], for all Spitzer-GLIMPSE sources with measurements in the four bands, situated at less than 7′ from the exciting star (#1) of G010.32−00.15. The big red dots correspond to sources with measurements more accurate than 0.15 mag in all four bands, the small red dots for the less accurate sources. See Fig. 9 for further information.
Current usage metrics show cumulative count of Article Views (full-text article views including HTML views, PDF and ePub downloads, according to the available data) and Abstracts Views on Vision4Press platform.
Data correspond to usage on the plateform after 2015. The current usage metrics is available 48-96 hours after online publication and is updated daily on week days.
Initial download of the metrics may take a while.