Fig. 17
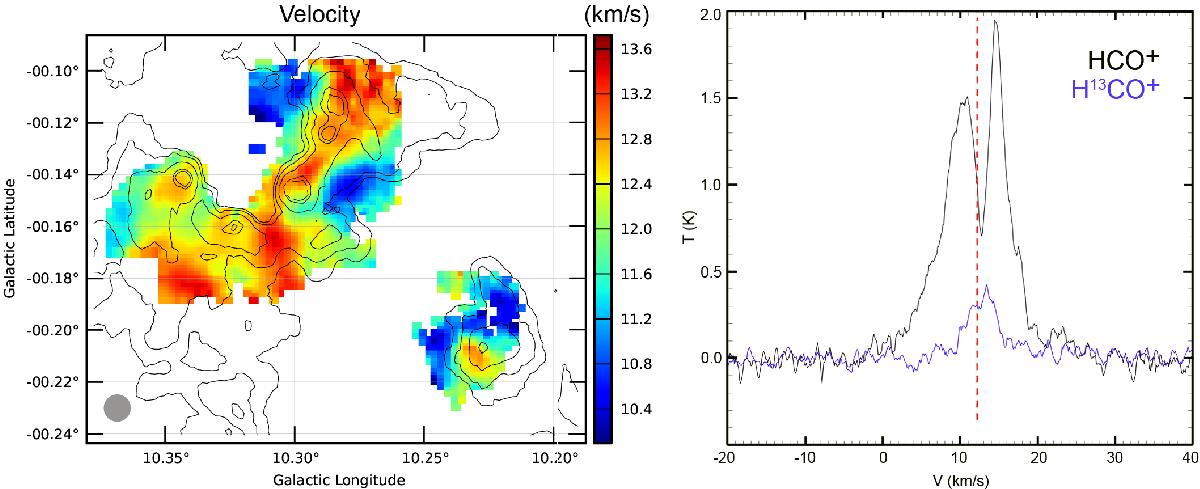
Main velocity component observed over the G010.32−00.15 field. Left: velocity field obtained with the HCO+ (1−0) molecular line. The contours are for the column density (levels of 0.5, 0.75, 1, 1.5, and 2 × 1023 cm-2). The 38″ beam is at the lower left. Right: velocity profile from a region of 36″ × 36″ centred on C3, at ![]()
![]() . The HCO+ line shows self-absorption whereas the H13CO+ line is optically thin. The red dotted line shows the velocity obtained by fitting the splitted HCO+ line with one gaussian.
. The HCO+ line shows self-absorption whereas the H13CO+ line is optically thin. The red dotted line shows the velocity obtained by fitting the splitted HCO+ line with one gaussian.
Current usage metrics show cumulative count of Article Views (full-text article views including HTML views, PDF and ePub downloads, according to the available data) and Abstracts Views on Vision4Press platform.
Data correspond to usage on the plateform after 2015. The current usage metrics is available 48-96 hours after online publication and is updated daily on week days.
Initial download of the metrics may take a while.