Fig. 16
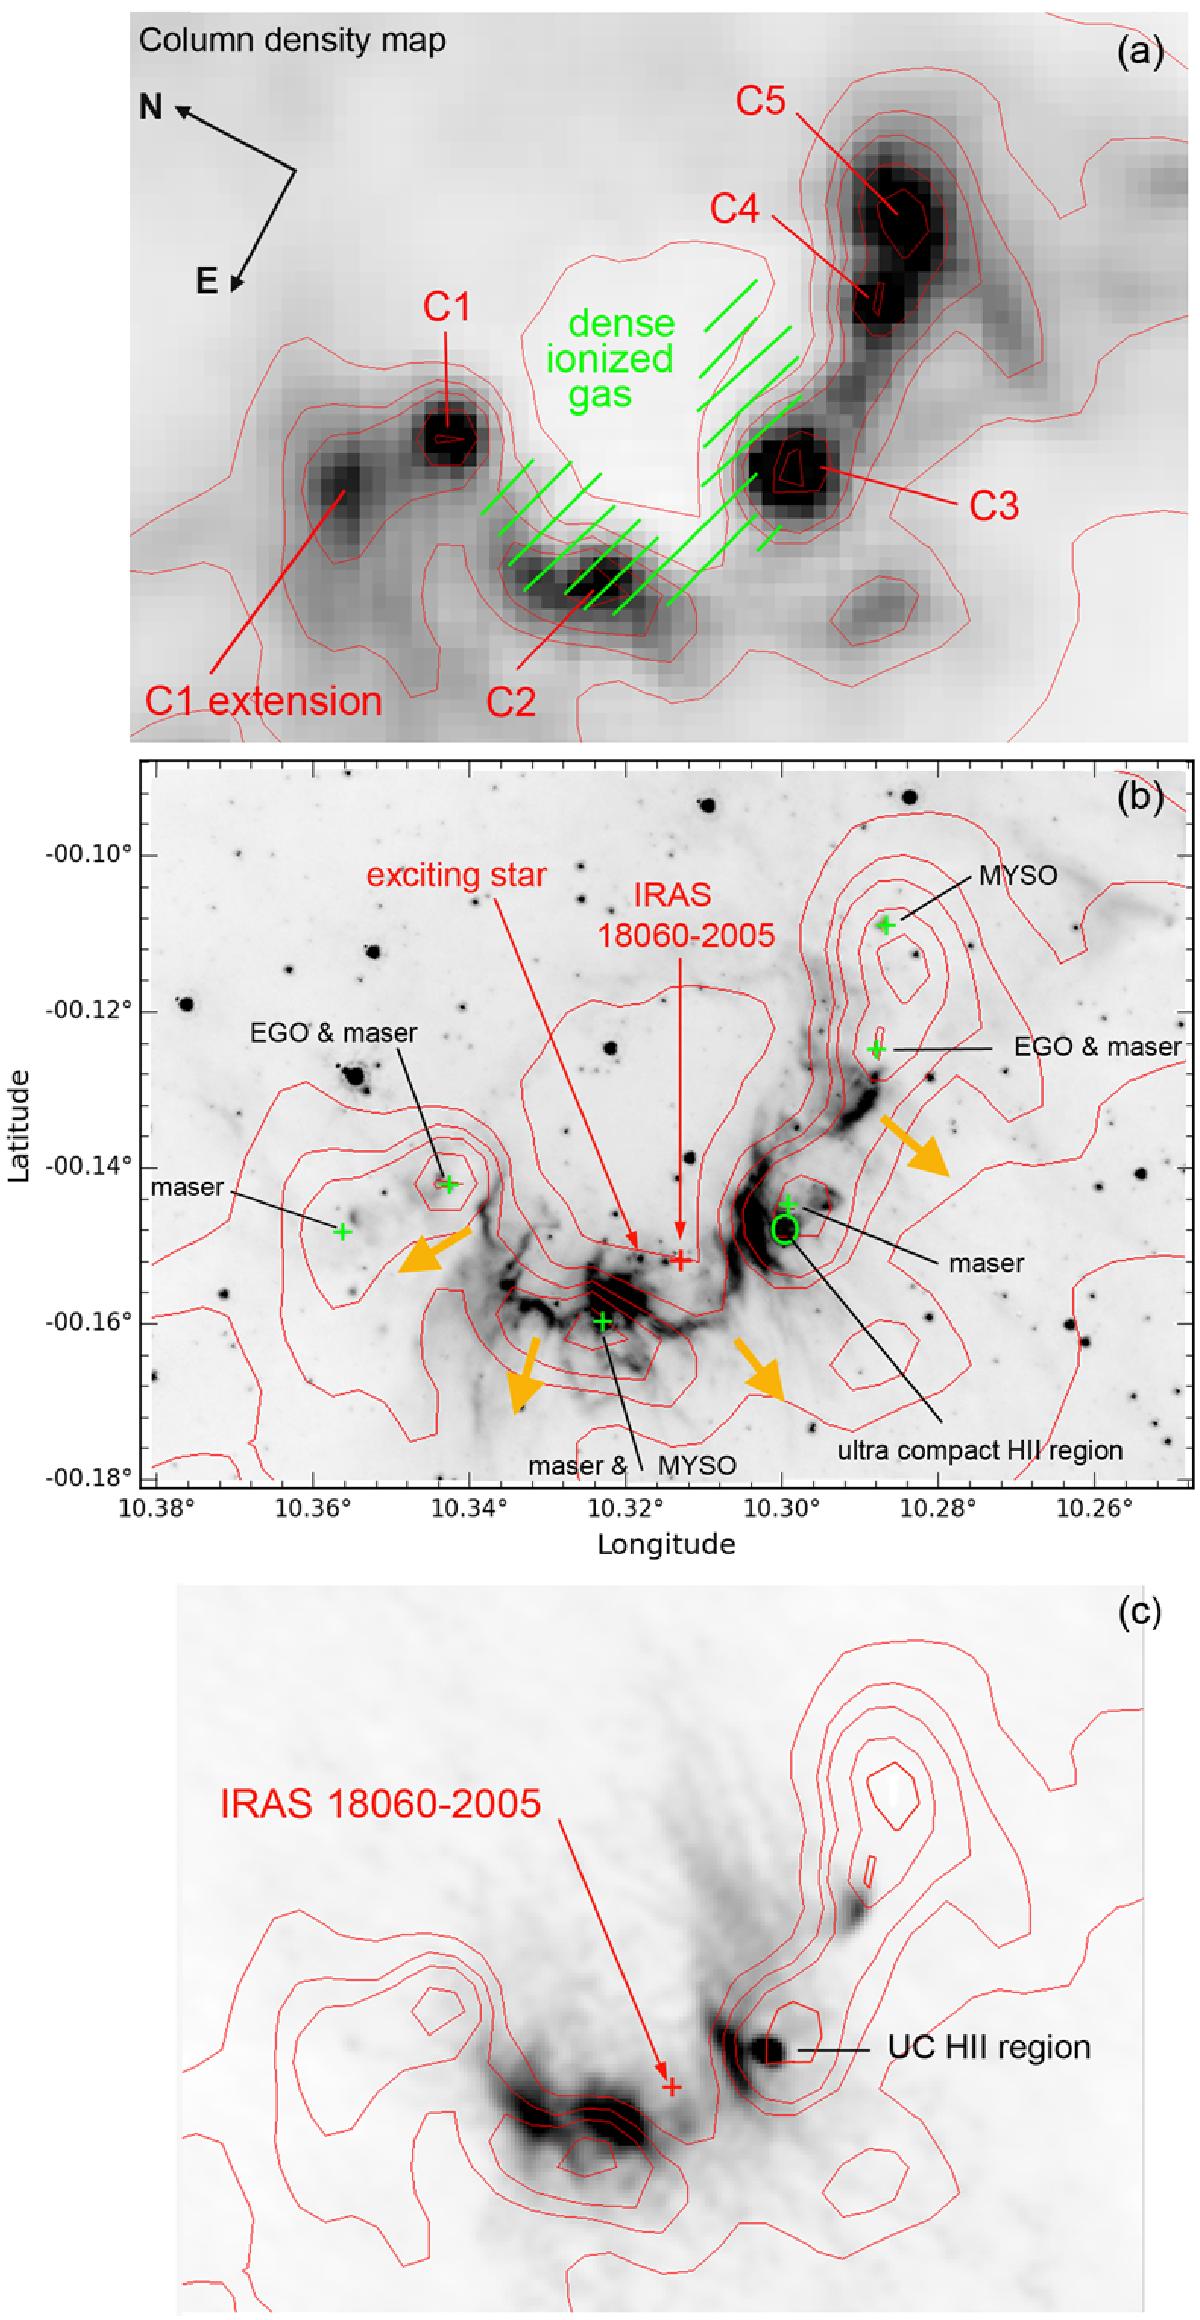
Identification of sources discussed in the text, in the vicinity of G010.32−00.15. a) Column density map showing the five clumps present at the waist of the bipolar nebula (red contour levels at 0.3, 0.5, 0.75, 1.0, 1.5, and 2.0 × 1023 cm-2). b) Spitzer 5.8 μm image; the plus symbols show the positions of the methanol masers, of the EGOs, the MYSOs, the UC H ii region, and IRAS18060-2005; the exciting star is also identified. The orange arrows show the pressure exerted by the ionized gas trying to escape from the central ionized region through the molecular shell, between the dense clumps. c) MAGPIS image at 21 cm showing the UC H ii region and the dense ionized layers bordering the IF (especially the borders of C2 and C3 turned towards the exciting cluster).
Current usage metrics show cumulative count of Article Views (full-text article views including HTML views, PDF and ePub downloads, according to the available data) and Abstracts Views on Vision4Press platform.
Data correspond to usage on the plateform after 2015. The current usage metrics is available 48-96 hours after online publication and is updated daily on week days.
Initial download of the metrics may take a while.