Fig. 14
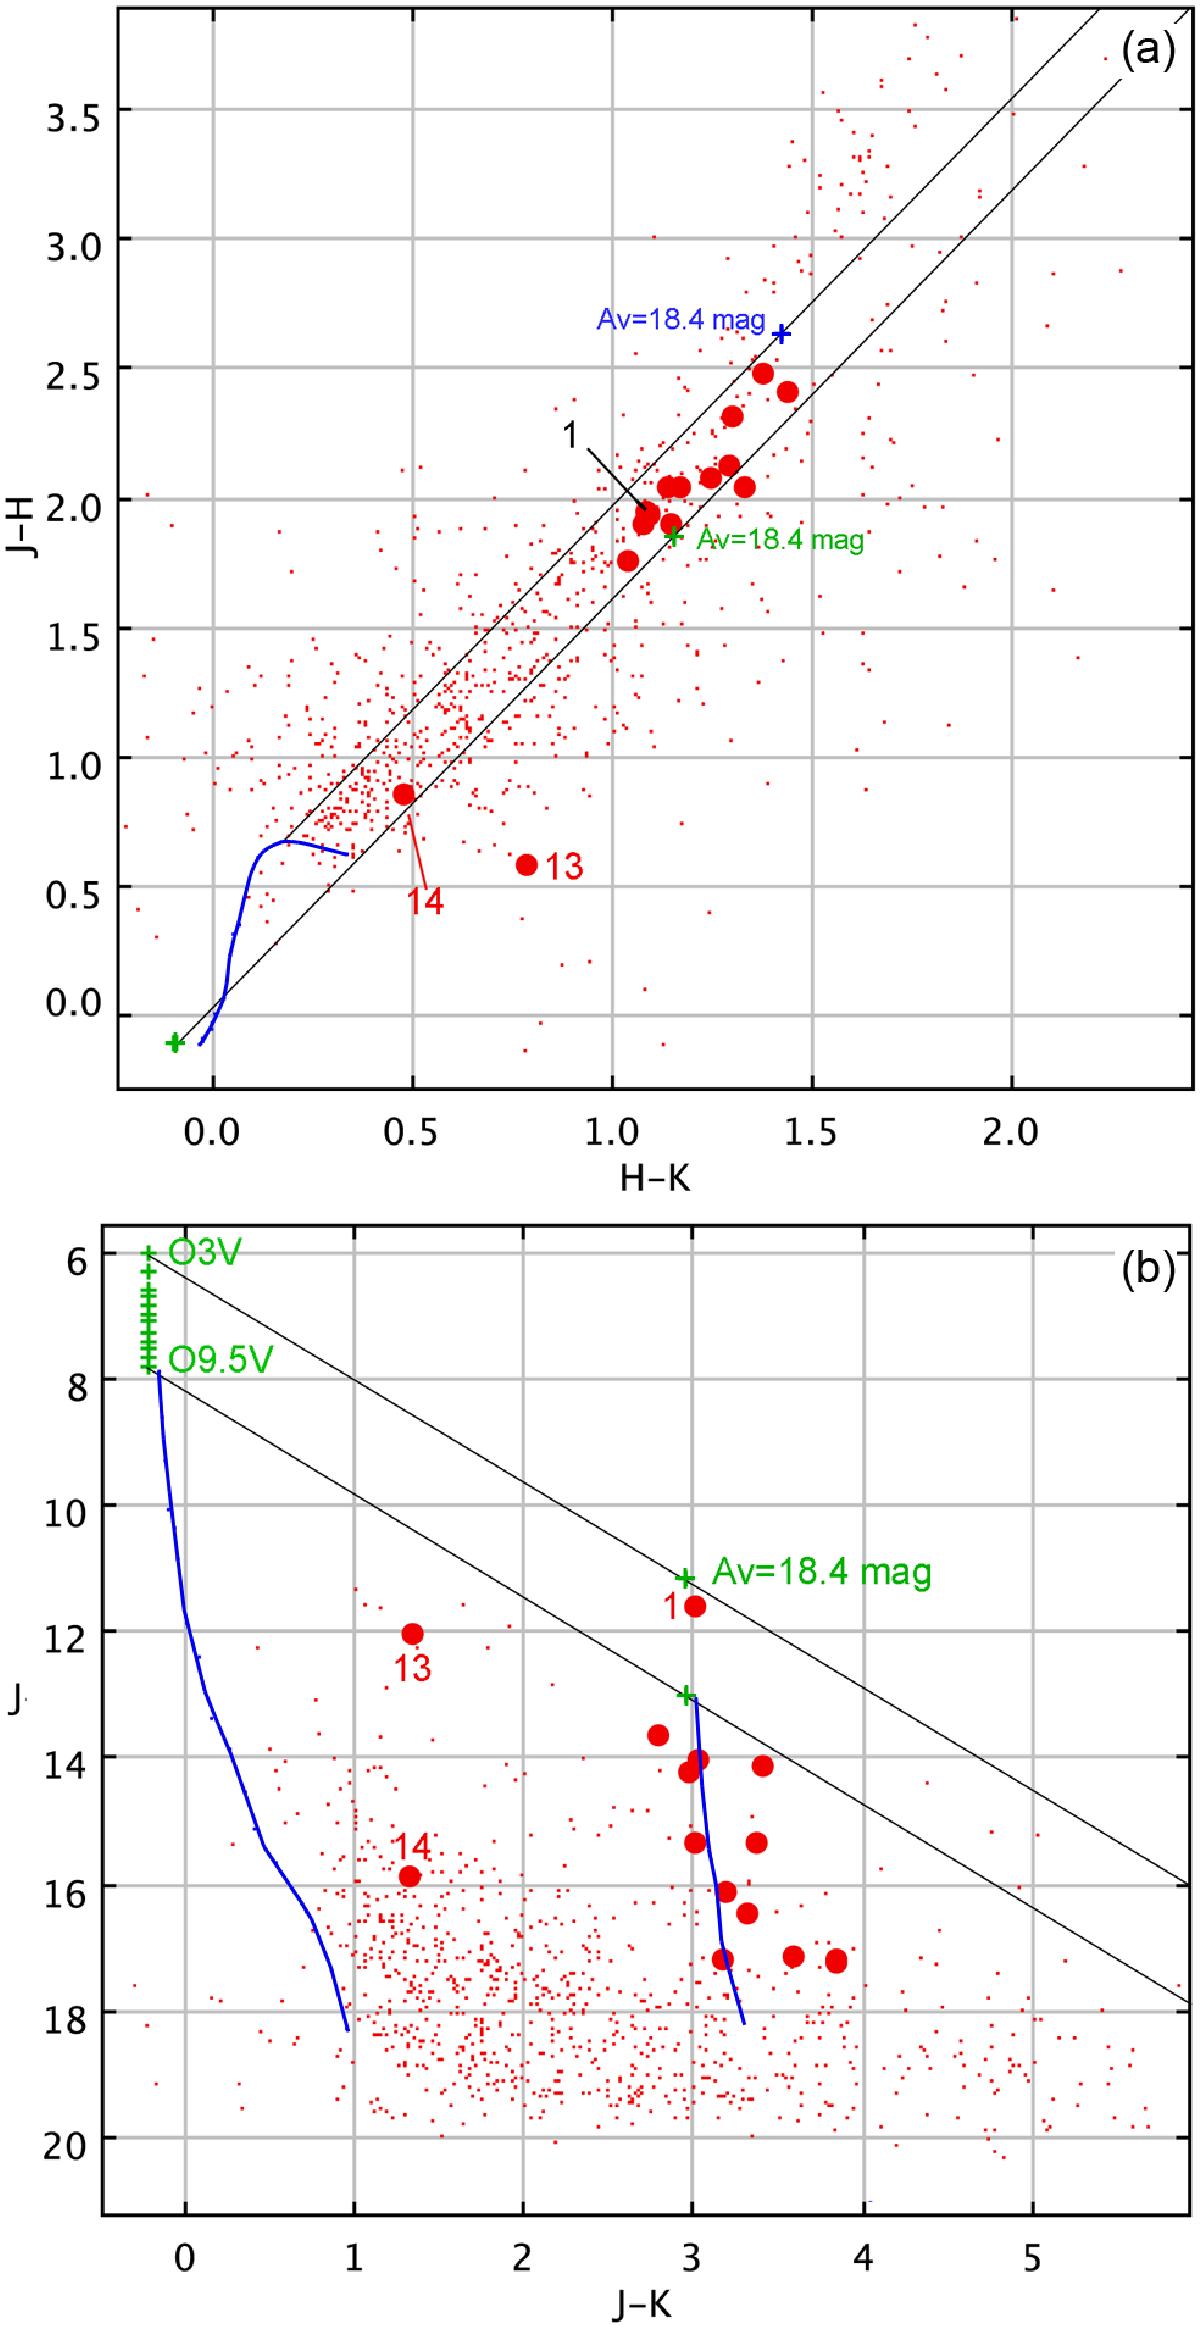
Near-IR photometry of the central exciting cluster of G010.32−00.15. a) J − H versus H − K diagram of the cluster’s stars discussed in the text (photometry from the UKIDSS catalogue). The small red dots correspond to stars located at less than 90″ of the exciting star (#1). The big red dots correspond to the stars identified in Fig. 13, located at less than 10″ from the exciting star. The green plus correspond to O stars, affected by 0 and 18.4 mag of visual extinction. The blue line is the main sequence for B stars and stars of later spectral types. Main sequence stars are expected to lie in the region contained between the two black reddening lines (derived from main sequence O and M0 stars). b) J versus J − K diagram; the red symbols have the same meaning as in Fig. 14a. The two black lines limit the zone occupied by reddened O stars at a distance of 1.75 kpc. The main sequence is also drawn for this distance, and for a visual extinction of 0 mag or 18.4 mag (extinction law of Rieke & Lebofsky 1985).
Current usage metrics show cumulative count of Article Views (full-text article views including HTML views, PDF and ePub downloads, according to the available data) and Abstracts Views on Vision4Press platform.
Data correspond to usage on the plateform after 2015. The current usage metrics is available 48-96 hours after online publication and is updated daily on week days.
Initial download of the metrics may take a while.