Fig. 12
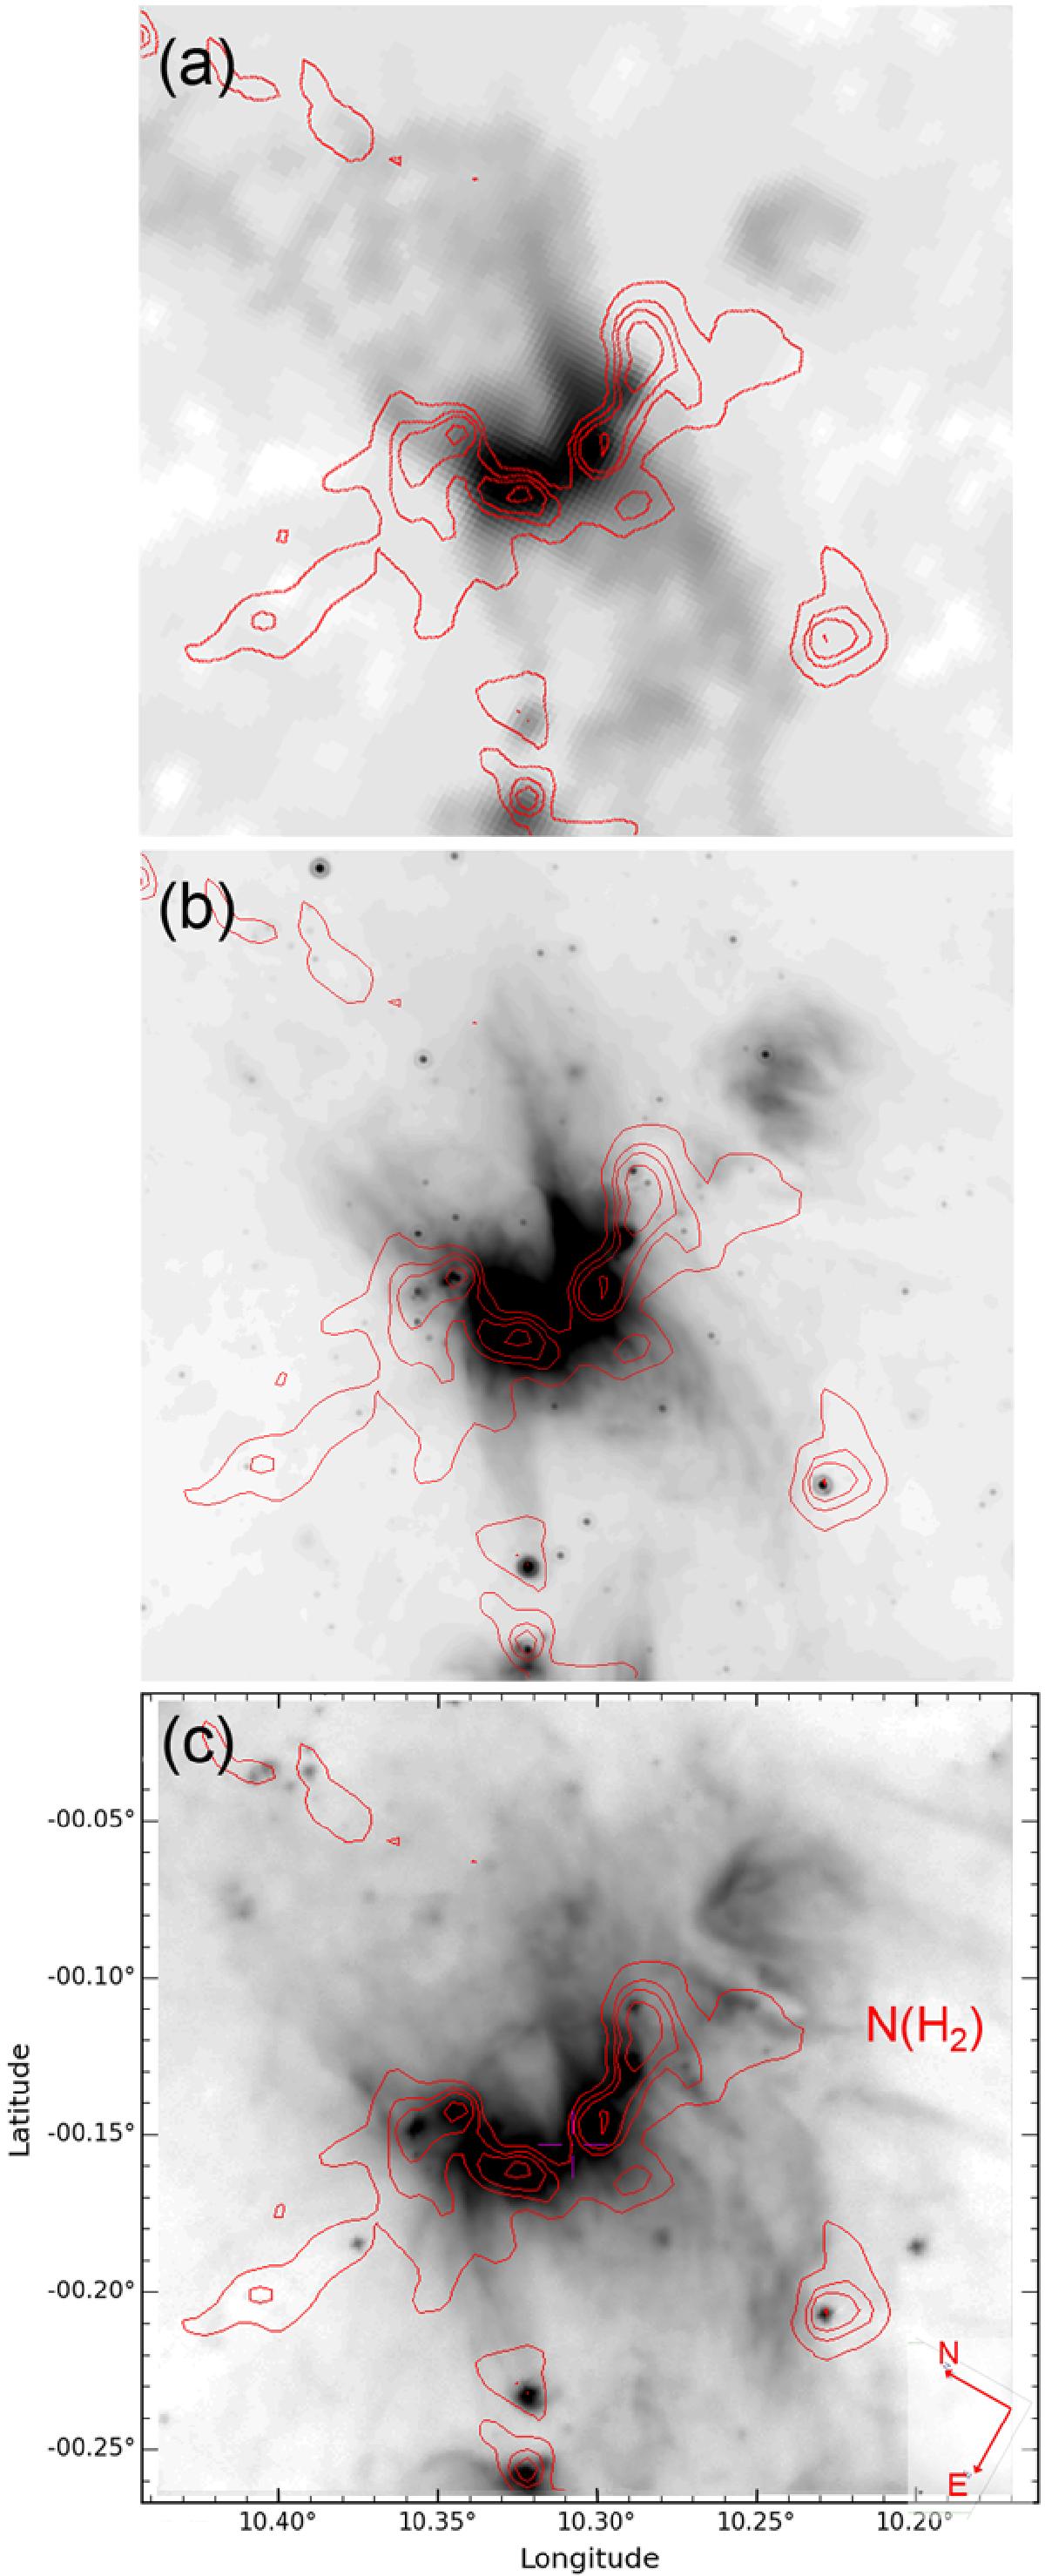
G010.32−00.15 at different wavelengths, showing the bipolar nature of the H ii region. The red contours correspond to the column density showing the dust clumps encircling the waist of the nebula (levels of 1.5, 1.0, 0.75, and 0.5 × 1023 cm-2). The underlying grey images are a) the VLA radio-continuum image at 21 cm; b) the MIPSGAL map at 24 μm; and c) the PACS map at 70 μm (all in logarithmic units to enhance the diffuse emission regions, especially the two ionized lobes).
Current usage metrics show cumulative count of Article Views (full-text article views including HTML views, PDF and ePub downloads, according to the available data) and Abstracts Views on Vision4Press platform.
Data correspond to usage on the plateform after 2015. The current usage metrics is available 48-96 hours after online publication and is updated daily on week days.
Initial download of the metrics may take a while.