Fig. 11
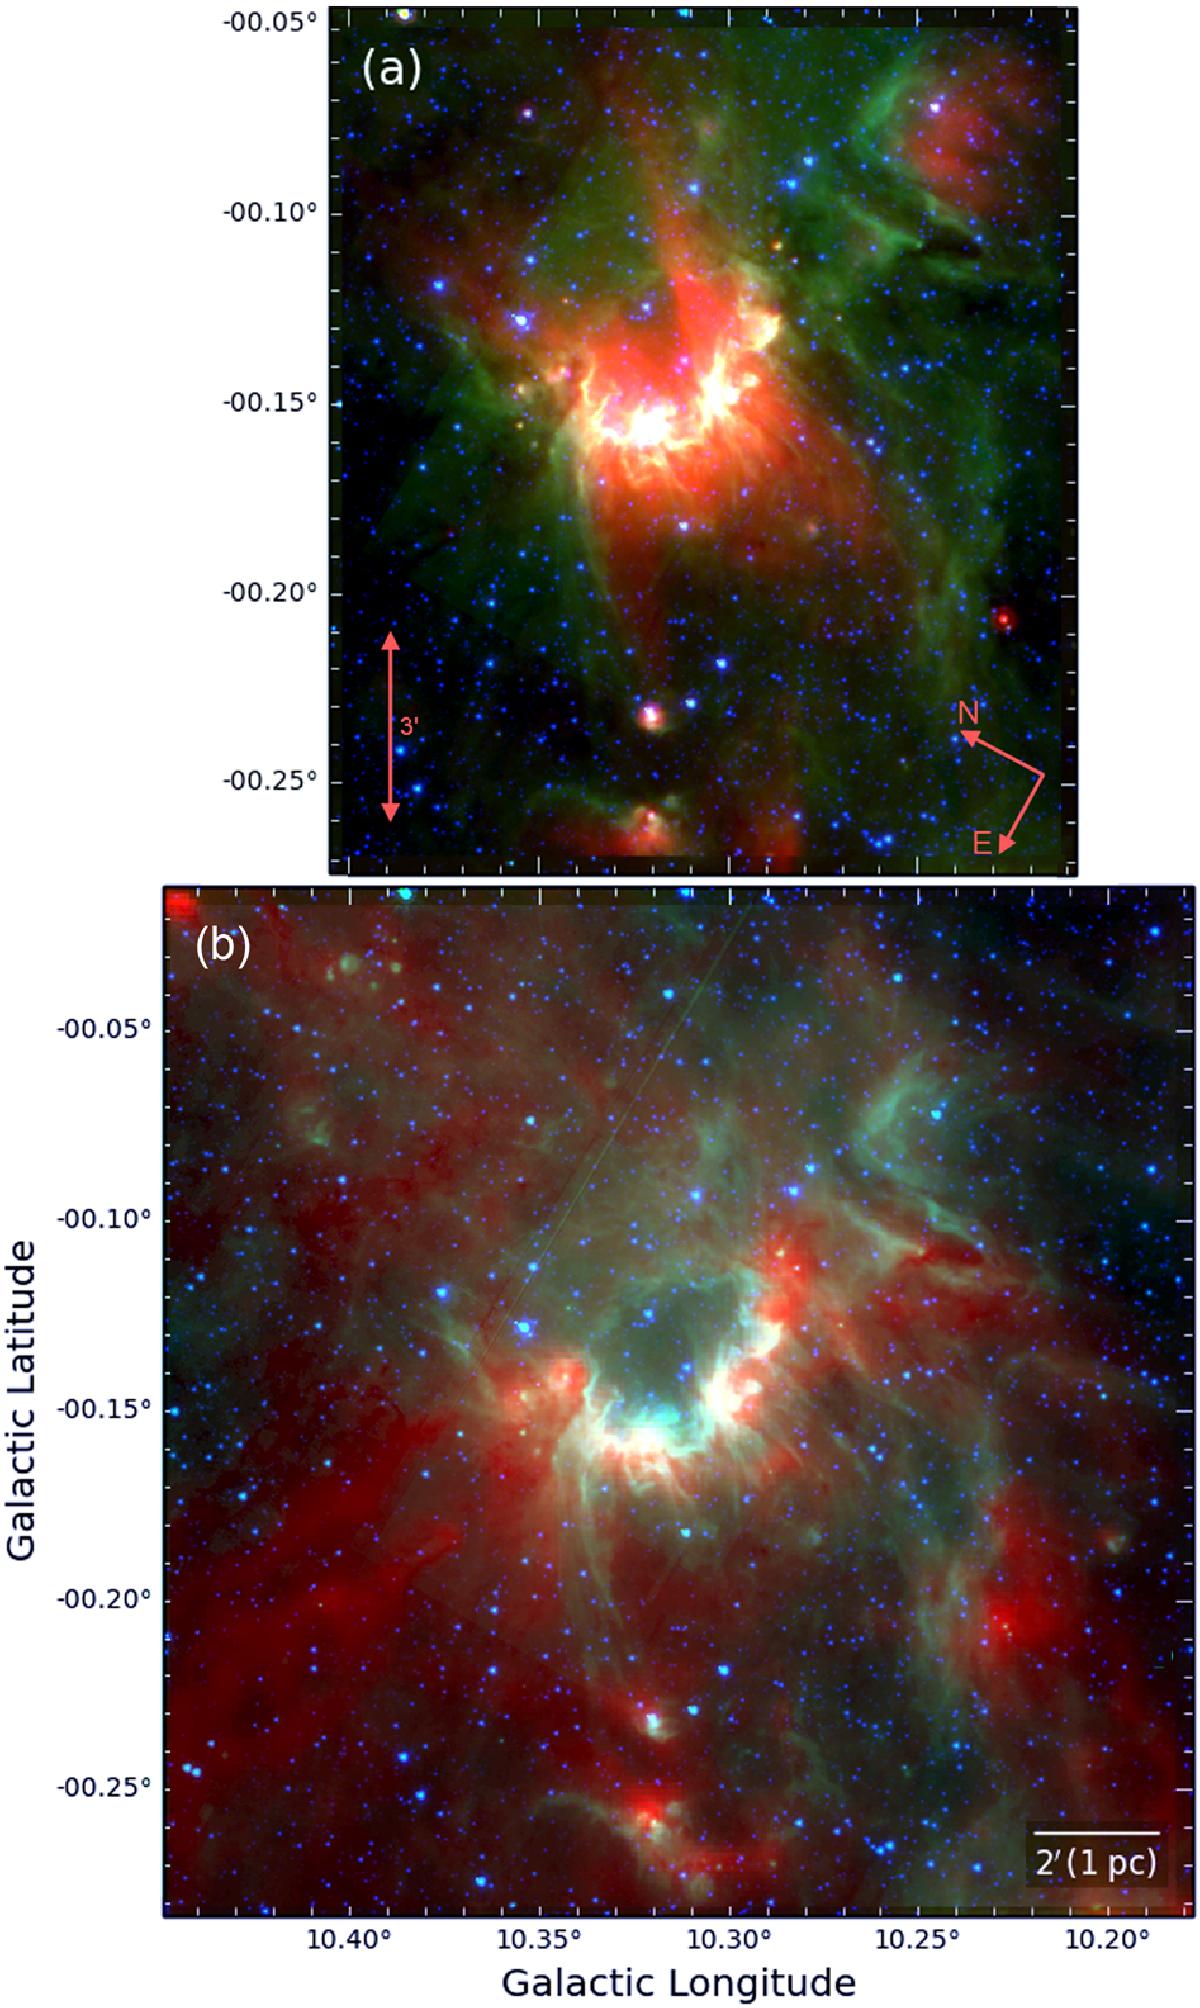
Bipolar nebula G010.32−00.15. a) Composite colour image with red, green, and blue for the Spitzer 24 μm, 8.0 μm, and 4.5 μm emissions, respectively. (Note that the 24 μm emission is saturated in the central region). b) Composite colour image with red, green, and blue for the 250 μm cold dust emission, 8.0 μm emission, and 3.6 μm stellar emission, respectively (the 250 μm emission is saturated in the C3 condensation, see Sect. 6.3).
Current usage metrics show cumulative count of Article Views (full-text article views including HTML views, PDF and ePub downloads, according to the available data) and Abstracts Views on Vision4Press platform.
Data correspond to usage on the plateform after 2015. The current usage metrics is available 48-96 hours after online publication and is updated daily on week days.
Initial download of the metrics may take a while.