| Issue |
A&A
Volume 582, October 2015
|
|
|---|---|---|
| Article Number | A68 | |
| Number of page(s) | 9 | |
| Section | Catalogs and data | |
| DOI | https://doi.org/10.1051/0004-6361/201322589 | |
| Published online | 09 October 2015 | |
A database of circumstellar OH masers⋆
Hamburger Sternwarte, Gojenbergsweg 112, 21029 Hamburg, Germany
e-mail: This email address is being protected from spambots. You need JavaScript enabled to view it.
, This email address is being protected from spambots. You need JavaScript enabled to view it.
Received: 2 September 2013
Accepted: 4 July 2015
Abstract
We present a new database of circumstellar OH masers at 1612, 1665, and 1667 MHz in the Milky Way galaxy. The database (version 2.4) contains 13 655 observations and 2341 different stars detected in at least one transition. Detections at 1612 MHz are considered to be complete until the end of 2014 as long as they were published in refereed papers. Detections of the main lines (1665 and 1667 MHz) and non-detections in all transitions are included only if published after 1983. The database contains flux densities and velocities of the two strongest maser peaks, the expansion velocity of the shell, and the radial velocity of the star. Links are provided for about 100 stars (<5% of all stars with OH masers) to interferometric observations and monitoring programs of the maser emission published since their beginnings in the 1970s. Access to the database is possible over the Web (www.hs.uni-hamburg.de/maserdb), allowing cone searches for individual sources and lists of sources. A general search is possible in selected regions of the sky and by defining ranges of flux densities and/or velocities. Alternative ways to access the data are via the German Virtual Observatory and the CDS.
Key words: masers / stars: AGB and post-AGB / circumstellar matter
The data are only available at the CDS via anonymous ftp to cdsarc.u-strasbg.fr (130.79.128.5) or via http://cdsarc.u-strasbg.fr/viz-bin/qcat?J/A+A/582/A68
Current address: Max-Planck Institute for Meteorology, Bundesstrasse 53, 20146 Hamburg, Germany.
© ESO, 2015
1. Introduction
Stars on the asymptotic giant branch (AGB) and red supergiants (RSG) lose copious amounts of mass and form spherically symmetric circumstellar envelopes (CSE) where numerous molecular species are formed. The oxygen-rich AGB stars and RSGs often show maser emission from OH (at 1612, 1665, and 1667 MHz), H2O (mostly at 22 GHz), and SiO (mostly at 43 and 86 GHz) molecules (Elitzur 1992; Gray 2012). Especially among optically obscured AGB stars, masers easily allow the determination of the chemistry and of the expansion velocities of their CSEs, and provide radial velocities of the stars. Detailed charts of the mass distribution and their movements can be obtained by interferometric studies (Bains et al. 2003). A sizeable fraction of OH/IR stars do not show the large-amplitude variations commonly seen on the AGB, implying that OH masers are also sustained during the early phase of post-AGB evolution (Engels 2002). Peculiar maser properties (e.g. extraordinarily high velocities or axi-symmetric morphologies) pinpoint infrared sources, which are identified as obscured objects in a more advanced post-AGB evolution phase (Zijlstra et al. 2001). The high luminosity of the masers together with the radial velocity information provided, allow the study of stellar kinematics up to the Galactic center region (Sjouwerman et al. 2002), and yield evidence of, for example, a bar in the Milky Way (Deguchi et al. 2002; Habing et al. 2006).
New radio observatories like the Atacama Large Millimeter Array (ALMA) and the forthcoming Square Kilometre Array (SKA) amply enhance the capabilities for astrophysical research with masers. They will multiply the number of observable maser transitions and will allow the study of masers to be extended to nearby galaxies. With the Atacama Pathfinder Experiment (APEX) the study of a number of H2O maser transitions in evolved stars is already in progress (Menten et al. 2008). A spectral line survey at 1 mm of the prototype O-rich star VY CMa already discovered a new H2O maser and detected several SiO masers (Tenenbaum et al. 2010), showing the potential for maser research with ALMA in the submm and mm range. The unprecedented sensitivity of the SKA will allow systematic and detailed studies of OH and possibly H2O masers associated with evolved stars and star forming regions in the Magellanic Clouds and members of the Local Group (Etoka et al. 2015). Future research aiming to compare the new stellar maser detections in extragalactic systems with the properties of better studied Galactic masers would benefit from efficient means to access the observations of the “classical” molecular maser transitions made over the past ≈40 yr.
Since their discovery, several thousand observations to detect masers in CSEs have been made. For OH masers, catalogs listing detections in AGB stars and RSGs are more than 20 yr old (te Lintel Hekkert et al. 1989; Benson et al.1990) and are more or less outdated. The te Lintel Hekkert et al. catalog contains detected 1612 MHz OH masers with their flux densities and velocities and covers the literature until 1984. The Benson et al. catalog lists references to OH maser observations and covers the years until 1989. The number of detected 1612 OH masers listed are 439 and 713, respectively. Since then the number of detected masers has almost tripled. The last OH maser catalog containing main-line detections is from Engels (1979).
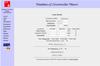 |
Fig. 1 Opening web page for access to the database of OH masers in circumstellar shells. The address is www.hs.uni-hamburg.de/maserdb/. |
We have now compiled a database of circumstellar OH masers, which includes almost all stars in the Milky Way with OH masers ever detected in one or several of the transitions at 1612, 1665, and 1667 MHz and contains in addition published observations with non-detections in these transitions since 1984. A first version of the database was published in 2007 by Engels & Bunzel (2007) and has been updated continuously since then. An extension that will also cover H2O and SiO masers is in the works.
In the last decade no larger surveys for OH masers have been made, and research has shifted toward interferometric and variability studies of known stellar masers. The interferometric studies focus, for example, on astrometry to derive distances (Vlemmings & van Langevelde 2007) or on polarization properties to derive magnetic field strengths (Amiri et al. 2011). To take this development into account, these follow-up observations were included as separate tables in the more recent versions of the database.
The database can be accessed via an internet portal (Fig. 1), which allows an efficient search using a variety of parameters. The database is also integrated in the Virtual Observatory1 and is available through the Cone Search protocol for simple positional queries2 as well as the Table Access protocol for advanced database queries3 allowing complex conditions and joins with other, potentially user-provided, catalogs. In tabular format the database content is available at the VizieR library of astronomical catalogs.
The content of the database is described in Sect. 2. The access of the database and the different selection options to search in it are described in Sect. 3. In Sect. 4 we analyze the properties of OH masers in CSEs using the content of the database and we finish the paper by summarizing the types of stars hosting OH maser emission and the role of the database for future maser research.
2. Contents of the OH maser database
The database is made up of a main table containing the survey observations and two auxiliary tables containing monitoring and interferometric follow-up observations for detected masers. The survey observations were made with single-dish radio telescopes and beginning in the 1980s also with the Very Large Array (VLA) and the Australian Telescope Compact Array (ATCA) interferometers.
2.1. Setup of the tables and completeness
The main table was set up with the contents of the te Lintel Hekkert et al. catalog. The following search for OH maser observations was made in the literature (refereed papers) published between 1984 and 2014. The database is considered to be almost complete for stars with 1612 MHz detections, but contains no stars observed and published prior to 1984 without detected 1612 MHz masers, while for the main lines (1665 and 1667 MHz) the database contains only measurements published after 1984. The database is restricted to Galactic masers. The auxiliary tables contain publications from 1974 onward, covering interferometric and monitoring observations since their beginnings.
2.2. Information content of the main table
In each publication containing circumstellar OH maser observations we searched for the following information:
-
the names of the stars or the OH maser designation;
-
the transition frequency 1612, 1665, or 1667 MHz;
-
coordinates;
-
peak flux densities and velocities of maser features;
-
radial velocity vrad of the star;
-
expansion velocity vexp of the CSE.
Not all information is always found and sometimes the meaning of a particular parameter or its unit differs between papers. We then transformed values and units to a common definition. All such modifications of the original data are logged in special reference pages (see Sect. 2.4), which are maintained for each paper included in the database.
Each database entry contains several fields used for administrational purposes. The “measurement number” uniquely identifies the particular entry, the “paper identification number” identifies the paper from which the data originates, and the “source number” assures that measurements from the same source are linked, even if names or coordinates differ (the need for such a link is described in Sect. 3.1). The fields “Mon.” (for monitoring) and “Maps” are flags, which are logically set to “true” if there is data in the auxiliary tables available.
2.2.1. Flux densities and velocities catalogued
At 1612 MHz, the profiles of circumstellar OH masers usually show a characteristic double-peaked profile, in which the two peaks are typically separated by Δv ≈ 30 km s-1. Peak flux densities and velocities of these two peaks are usually tabulated in the discovery papers to characterize the maser. The double-peaked profile is created by radially masing regions in the front and the back of the star, which are moving away from the central star with a velocity Δv/ 2. The database contains therefore the flux density fblue and the velocity vblue of the (most) blue shifted and fred, vred of the (most) red shifted maser peak. In a few cases where peak flux densities and/or velocities were not given this information was taken directly from the published spectra. Based on the assumption of a radially symmetric CSE, Δv/ 2 is its expansion velocity vexp, while the center of the velocity interval covered by the two maser peaks is the radial velocity vrad of the star. The velocities vexp and vrad are included in the database. They are taken either from the paper or are calculated from the peak velocities.
A different method of selecting the two maser features to be included in the database and to determine vexp and vrad was used for the main lines in those cases where the maser had no simple double-peaked profile. Circumstellar masers in general and the OH maser main features in particular often consist of many individual maser features spread over a velocity interval of several km s-1. In such cases papers only list peak flux densities and velocities of the strongest features. Because of the variability of the masers a particular feature selected, however, only temporarily characterizes a given maser. Therefore, in principle the integrated flux and the velocity interval over which maser emission has been observed are more suitable parameters to characterize a particular maser. Owing to the lack of information on these parameters in most papers, for the OH main features we listed the peak flux densities and velocities of the two strongest maser features to characterize the strength of the maser. The velocities vexp and vrad were then not calculated from these peak velocities, but were explicitly calculated from the velocity interval covered by the outermost maser peaks listed.
2.2.2. Special cases and verification
If a paper lists several observations of the same star, we transferred the observation with the strongest peak flux density measurement to the database. Sometimes only a single maser feature was observed. The database contains an entry “spectral type” that is set by default to “D” (double), but for these observations is set to “S” single. For a few sources the “spectral type” is set to “I” (irregular) if the original paper gives this classification. Flux density and velocity for single maser features are listed as fblue and vblue, and vrad = vblue is set to ensure that the source can be included in searches restricting the radial velocity. The feature is listed as fred and vred, and vrad = vred is set if this can be inferred from other maser observations. For observations with non-detections the entry fblue contains the 3σ value of their sensitivity.
To verify the correct registration of the data in the database, the entries in the database and the entries in the paper were compared manually for two observations randomly taken. However, erroneous entries cannot be excluded, especially if input tables were not available in electronic form and data were transferred manually or from scanned tables.
2.3. Information content of the auxiliary tables
The entries in the main table are flagged (for details see Sect. 3.3) if monitoring or interferometric follow-up observations were made for a particular frequency. Information about such follow-up observations is stored in two auxiliary tables. The basic entries for the auxiliary tables are
-
the names of the stars or the OH maser designation;
-
the coordinates;
-
the transition frequency: 1612, 1665, or 1667 MHz.
The specific entries for the first auxiliary table, the monitoring table, are
-
the time interval covered by the observing epochs;
-
if available, the range of flux densities observed.
The specific entries for the second auxiliary table, the interferometry table, are
-
the name of the interferometer used;
-
the angular resolution;
-
the sensitivity of the observations;
-
the presence of polarization information indicated by a yes/no entry;
-
the number of maps;
-
the range of observing epochs.
As was done for the main table, special reference pages (see below) are maintained for each paper included in the database. All modifications of original data are logged in these pages. As before, the correctness of the table entries was verified for each paper by a manual comparison of two random database entries with the original paper.
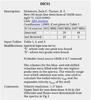 |
Fig. 2 Individual reference page for the main line observations of Dickinson & Turner (1991). Statistics, an external link to the SAO/NASA Astrophysics Data System (ADS), references for additional data, and modifications to the original data in the paper are given. |
2.4. Reference pages
In principle, all data were taken directly from the paper as published. If data from other sources were included (for example coordinates), or the data was transformed, this has been logged on an individual “reference page”. An example is given in Fig. 2. A reference page was created for each paper contained in the database. This page gives the journal, where the paper was published, a link to the SAO/NASA Astrophysics Data System4 (ADS), the source of the coordinates (if not from the paper itself), the number of sources observed and detected, the source for the input data (e.g. tables of the printed version or online tables), modifications applied to the input data, and comments. Thus, the origin of all information included in the database, and which was not provided directly by the paper, can be traced back by consulting the reference pages.
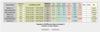 |
Fig. 3 Result from a cone search at the position 18 42 22.2 −08 05 01 (2000) with a search radius of 10′′. The output page displays the content of the main table. The source names are linked to the SIMBAD database. Access to entries in the auxiliary tables (in this case no entries are available) is provided by the links in columns “Mon.” and “Maps”. We note the inclusion of the entry from the te Lintel Hekkert et al. (1989) catalog (LIN89). Although the catalog position is outside the search radius, the observation is listed because of an internal link to the “primary observation” of Engels & Jiménez-Esteban (2007) labeled as ENG07 (see Sect. 3.1). |
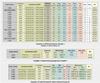 |
Fig. 4 Examples for the content in the main and auxiliary tables of the database for the Mira variable U Her. Top: result from the search in the main table. The columns “Mon.” and “Maps” are activated (Y = “Yes”) for several frequencies, linking to monitoring and interferometric observations at these frequencies compiled in the auxiliary tables. Middle: result from the search in the monitoring table at 1612 MHz. A maximum flux density of 1.5 Jy was reported for U Her during ≈11 yr of monitoring. Bottom: compiled interferometric observations at 1667 MHz. |
3. Access to the OH maser database
The OH maser database can be accessed via the web interface5 (Fig. 1). The web interface consists of the main search page and supplementary pages for documentation and additional information.
3.1. Main search page
On the main page there is a choice of three different search modes:
-
Cone search. This mode allows the search for catalog entries in thevicinity of a celestial position. Equatorial or Galactic coordinatesystems can be selected to enter coordinates. The search radius isrestricted to <1000′′. The search can be restricted further by limitingthe range of frequencies, radial velocitiesvrad, expansion velocities vexp, and flux densities.
-
List search. This mode works in the same way as the cone search mode, but a table with multiple search positions can be uploaded.
-
Parameter search. This mode allows a general search in the database. It works like the two previous modes, except that a search area on the sky can be defined by coordinates. Without restriction of any of the parameters the complete content of the database is accessed.
There are several options to restrict the output. The minimum output is given by source name, frequency, and the links to the auxiliary tables. Coordinates, flux densities and velocities, and literature references for the observations can be added to the output. It is possible to suppress the listing of non-detections. The output can be sorted by several parameters and can be downloaded as a formatted ASCII file for off-line analysis.
Cone and list searches require a search radius, and therefore the completeness of such searches is not given. The reason are the often quite poor (radio) coordinates given in the earlier literature, which may deviate from the true position by several arc minutes. Only part of the observations are listed, especially if small radii are chosen. An increase in the radius often leads to the inclusion of possibly non-related neighboring sources into the output. We decided, therefore, to implement a special mechanism to ensure that all observations for a particular source are actually listed in the output. For each OH maser source a particular observation with accurate coordinates is chosen as the “primary observation” and all other observations of this source are linked to it as “secondary observations”. The link was implemented in the database by assigning the same internal “source number” to all observations. Observations with largely deviating coordinates (e.g. 30−300′′) were assigned to the same source (i.e. they were linked together) if the velocities of the maser features coincided. An example is given in Fig. 3. All searches are made among the primary observations, but the result of the search also contains all secondary observations. This optimizes the completeness for position based searches at the expense of the completeness for searches using the other parameters. This is the case if, for example, the search is restricted to a minimum flux density. Sources matching this limit in a secondary observation but not in the primary observation will not be selected.
More details can be found in the supplementary pages.
3.2. Supplementary pages
The supplementary pages can also be accessed over the web interface (see Fig. 1) and contain information on the organization of the database (Link: “Description”), on the definition of the input and output parameters (Link: “Parameters”), on the origin of the data (Link: “References”), on basic statistics of the content of the database (Link: “Statistics”), and on the history of releases (Link: “History”). Also, the auxiliary tables (Links: “Maps” and “Monitor”) can be directly accessed via the web interface.
The “Description” page contains the basic information about the database as described in this paper and will log future changes to content and structure. The outdated Description pages from earlier releases can be accessed by the “History” page, and allow the development of the database to be followed. The “Parameters” page describes in detail the parameters used (definition, ranges of values, units). The link “References” lists all papers used for the compilation of the database. The individual reference pages (see Sect. 2.4) can be accessed here by a link labeled by an acronym (for example ENG07 for Engels & Jiménez-Esteban 2007). This acronym is also used as a label for the link in the database output, pointing to the original paper from which a particular observation came from. The “Statistics” page gives a compressed overview on the content of the current release of the database and is described in Sect. 4.
3.3. Access to monitoring and interferometric observations
Figure 4 displays part of the content of the database for the Mira variable U Her. All OH maser transitions observed in this star were included in several monitoring programs and interferometric studies. Therefore links are provided in the columns “Mon.” and “Maps” for these frequencies. The 1612 MHz maser was monitored for almost a decade as shown in the middle panel of Fig. 4. The interferometric observations compiled for the frequency 1667 MHz are shown in the bottom panel of the same figure.
The full content of the monitoring and interferometric tables can be accessed directly using the supplementary pages “Monitor” and “Maps”. The monitoring table contains 180 long-term observations of 78 stars published in 11 papers. The interferometric table contains 427 observations of 102 stars published in 66 papers. So far, less than 5% of all stars showing OH maser emission have been monitored and/or mapped.
3.4. Links to external databases
Links to external databases are provided for SIMBAD6 and for ADS. The link to SIMBAD for each source in the database is provided in the field “Source Name”. As the search in SIMBAD is made by the source name a failure of matches is possible. The link to ADS is used to access the original literature providing the data. Access to the literature is either possible from the individual reference pages (see Sect. 2.4) or by the label listed in column “Ref.” of the output pages.
4. Properties of OH masers in circumstellar shells
4.1. Detection rates
The database in its version 2.4 contains 13655 OH maser observations at frequencies 1612 (62%), 1665 (17%), and 1667 MHz (21%). These observations belong to 6356 different stars with 2341 (37%) stars detected in at least one transition. The overall detection rate is compatible with the numbers in the catalog of Benson et al. (1990), who reported 32% detections among 2253 stars observed. The vast majority (94%) of the detected sources show maser emission at 1612 MHz.
Surveys for OH maser emission were mostly made at 1612 MHz and only occasionally in the weaker main lines. The major surveys, which discovered the bulk of the 1612 MHz OH masers were the ATCA/VLA OH 1612 MHz survey by Sevenster et al. (2001) with 766 detections, the Dwingeloo/Effelsberg/Parkes 1612 MHz OH survey of IRAS point sources by Te Lintel Hekkert et al. (1991) with N ≈ 740 detections, and the Arecibo 1612 MHz survey of color-selected IRAS sources by B.M. Lewis and collaborators (Lewis 1994, and references therein) with N ≈ 400 detections.
Most of the main-line observations are follow-up observations of stars already detected at 1612 MHz. The detection rate for 1667 (1665) MHz masers among stars with 1612 MHz detections is 62% (39%). The detection rate for 1665 MHz masers raises to 58%, if 1612 and 1667 masers are both present. Among stars observed but not detected at 1612 MHz the detection rates for 1667 and 1665 MHz masers decrease to 10% and 9%. Rarely a 1665 MHz maser is detected without accompanying 1667 MHz emission. Among the stars not detected at 1612 and 1667 MHz the detection rate for 1665 MHz masers is only 1.5%.
The numbers given here are affected by selection effects which are difficult to quantify, because of the heterogeneous surveys and follow-up observations contributing to the database. However, a comparison with the major targeted surveys suggests that the numbers are representative. The Dwingeloo/Effelsberg/Parkes survey made at 1612 MHz toward IRAS sources with flux densities S12 μm > 3 Jy had a detection rate of ≈30% (te Lintel Hekkert et al. 1991). The Arecibo 1612 MHz survey has a superior sensitivity and increased the detection rate among IRAS sources with flux densities S25 μm > 2 Jy to 39% (Lewis 1994). Both surveys used IRAS color selected samples and make up for 34% of all observations contained in the database. Their rates are close to 35%, the fraction of detected 1612 MHz masers among all sources listed in the database. For the main lines, Lewis (1997) obtained 1667 and 1665 MHz detection rates of 56% and 35% among IRAS sources previously detected at 1612 MHz. Lewis’ observations were made with a sensitivity of 20 mJy (3σ). Both rates are quite similar to the detection rates given above for the database. Lower rates were reported by David et al. (1993), who obtained a detection rate at 1667 MHz of 24% among IRAS color selected sources. For sources also detected at 1612 MHz this rate increases to 31% (Le Squeren et al. 1992). Their lower rates are likely caused by the poorer sensitivity limit of 120 mJy (3σ). The role of the sensitivity of the observations is also evident, if the main line detection rate is calculated in the database as a function of the 1612 MHz flux density. Dividing the sample of sources with 1612 MHz detections according to peak flux density F(1612 MHz) into two parts equal by number, the 1667 MHz detection rate is 67% for F(1612 MHz) >0.5 Jy and 44% below this level.
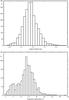 |
Fig. 5 Distribution of the 1612 MHz peak flux densities (upper panel) and expansion velocities (lower panel). The maxima are at fpeak ≈ 0.5 Jy and vexp ≈ 14 km s-1. About a dozen sources with vexp = 40−80 km s-1 are excluded from the plot. |
4.2. Flux densities and shell expansion velocities
The database provides radial velocities vblue, vred and peak flux densities fblue, fred of the masers for detected stars. For stars with OH masers exhibiting a double-peaked profile the radial velocity vrad of the star and the expansion velocity vexp of the shell can be derived from the peak velocities. Figure 5 shows the distribution of the 1612 MHz peak flux densities of the masers and of the shell expansion velocities up to vexp = 40 km s-1. For the construction of the flux density distribution the strongest of the maser emission features is used. The distribution peaks at log fpeak ≈ −0.3 ± 0.2 (fpeak ≈ 300−800 mJy), which is close to the sensitivity limit of the major surveys. The decrease of the distribution below this peak is therefore likely due to incompleteness of the database.
The distribution of shell expansion velocities is composed of three parts. Most of the sources (68%) have 10 ≤ vexp ≤ 20 km s-1 with a pronounced peak at 14 km s-1. A quarter of the sources (24%) make up the low-expansion-velocity part, of which about 47% have Galactic latitudes b> |5°| (see below). A minority (7%) have unusually high expansion velocities with vexp> 20 km s-1. The extreme sources with vexp> 35 are M-Supergiants, post-AGB stars, unclassified objects, and two cases where the maser peak identifications are doubtful.
4.3. Distribution in Galactic coordinates
The distribution of the stars exhibiting OH maser emission in Galactic coordinates is shown in Fig. 6. The distribution in longitude peaks in the Galactic center region (l ≈ 0°). Outside the longitude range −90 <l< + 90° shown, 247 stars (10.6%) were detected. The lower detection rate at larger longitudes was found already by the early surveys (Le Squeren et al. 1992; Lewis 1994). Lewis attributes this difference to variations in the ambient UV field, which is responsible for the production of OH via the dissociation of H2O molecules. There is a pronounced asymmetry in the number of OH emitting stars with respect to the Galactic center (Figs. 6a and c). At + 10 <l ≤ + 90° the number of detected stars is a factor of 1.8 higher than in the corresponding range at −90 <l ≤ −10°. This is most likely a selection effect due to the contributions of the larger radio telescopes in the northern hemisphere on Earth. However, Sevenster et al. (2001) found in their homogeneous ATCA/VLA OH 1612 MHz survey a similar but less pronounced asymmetry. They attributed the higher incidence of detections by a factor of 1.25 to the presence of the Galactic bar extending to higher longitudes on the northern side of the Galactic center.
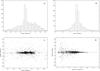 |
Fig. 6 Statistics of 2341 detected OH masers in the database. The upper panels show in a) the distribution in Galactic longitudes; and in b) in Galactic latitudes. The lower panels show in c) the distribution on the sky in Galactic coordinates; and in d) the range of Galactic latitudes for given expansion velocities. This last plot uses velocity information from 1967 stars and is truncated at 35 km s-1 for display purposes, excluding 15 sources with vexp = 35−80 km s-1. |
The distribution of the stars in Galactic latitude are concentrated toward the Galactic plane (Fig. 6b). Outside the latitude range −15 < b < +15° shown, only 198 stars (8.5%) were detected. This concentration toward the Galactic plane is in part due to the restricted latitude coverage of the major OH maser surveys. The lower panels in Fig. 6 show the Galactic distribution in a different manner and show the dependence of the expansion velocities on Galactic latitude. The pronounced peak at the Galactic center region in both longitude and latitude (Figs. 6a−c) is biased owing to several dedicated surveys in this region. In Fig. 6d, the larger spread in Galactic latitude at small expansion velocities (vexp ≤ 10 km s-1) is real, however, and is explained by Lewis (1991) as a superposition of low-latitude high-mass AGB stars with vexp ≈ 15 km s-1 and low-mass AGB stars with vexp ≈ 5 km s-1 distributed over a much larger latitude range. With few exceptions, high expansion velocities (vexp > 20 km s-1) are found only among stars in the Galactic plane (|b| < 2°), implying that vexp is statistically an indicator for main-sequence mass. Higher expansion velocities are reached only by the higher mass AGB stars.
4.4. OH maser luminosities
To characterize the observed strength of a maser, peak flux densities are usually given in the literature. Integrated fluxes are only rarely available, and therefore we calculated OH maser luminosities as specific luminosities Lν = fpeak ∗ 4πD2 using peak flux densities fpeak, as derived in Sect. 4.2, and adopting kinematic distances D. To calculate kinematic distances we used the prescription from Reid et al. (2009) with updated Galactic and solar motion parameters. The distance to the Galactic center was set to R0 = 8.4 kpc and the circular rotation speed was set to Θ0 = 247 km s-1 (Brunthaler et al. 2011). At 1612 MHz only sources with a double-peaked maser spectrum were used because otherwise the radial velocity is rather uncertain. In those cases, where the kinematic distance is ambiguous, we used the near kinematic distance. For the main lines we used only sources that have a near kinematic distance determined with 1612 MHz velocity information.
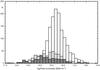 |
Fig. 7 OH Maser specific luminosity distributions Lν in Watt Hz-1 assuming near kinematic distances. Included are 1456 sources with reliable radial velocities, e.g. having double-peaked spectra at 1612 MHz (unfilled bars). Superposed are the distributions of 461 sources with 1667 MHz emission (bars with light gray shading) and 275 sources with 1665 MHz emission (bars with heavy gray shading). |
The distribution of the maser specific luminosities Lν is shown in Fig. 7. The core of the 1612 MHz OH maser luminosity distribution can be modeled by a Gaussian curve centered on log (Lν) = 15.30 and with a width FWHM = 1.25, corresponding to a typical luminosity range 0.5−8.4 × 10¹⁵ Watt Hz-1. In principle, the distribution displayed will underestimate the true luminosity distribution because part of the sources will be located at larger distances corresponding to the far kinematic distances. Their luminosities are underestimated, but there is no distinct excess feature in the low-luminosity tail of the distribution, which could be assigned to such sources. A recalculation of the specific luminosity distribution using far kinematic distances leaves the width unchanged and shifts its center to log (Lν) = 15.50. The mean specific luminosity ⟨ Lν ⟩ at 1612 MHz is therefore between 2 and 3 × 10¹⁵ Watt Hz-1.
The distributions in specific luminosities Lν of the main lines are rather broad and similar to each other. They cannot be represented by a Gaussian curve and therefore we determined the mean specific luminosities using the median. This gives ⟨ log (Lν) ⟩ 1667 MHz = 14.75 and ⟨ log (Lν) ⟩ 1665 MHz = 14.59 compared to ⟨ log (Lν) ⟩ 1612 MHz = 15.42. The main lines are therefore a factor ≈6 less luminous than the satellite 1612 MHz line. However, the ratio of specific luminosities between the 1612 MHz line and the main lines is dependent on the mass-loss rates. At lower rates typical for Mira variables this ratio is small, so that often main lines are detected while the 1612 MHz line is not. At higher rates typical for OH/IR stars the 1612 MHz line clearly prevails (Lewis 1989). Therefore the mean specific luminosities give the gross average for all sources in the database only.
5. Discussion
The generally broad distributions in the main parameters characterizing the OH maser emission (velocities, specific luminosities) and their host stars (Fig. 6) indicate that these masers arise from diverse environments. The characterization of these different environments requires the analysis of the optical and infrared emission of the stars, which will not be followed here. Such comprehensive and still up-to-date analyses are provided by Chen et al. (2001) and Kwon & Suh (2012). The major contributors to the database are AGB stars with oxygen-rich chemistry. This includes Mira variables, OH/IR stars, and probably a sizeable fraction of post-AGB stars. The masers are located in spherical circumstellar dust shells with different dust densities and expansion velocities. Among the post-AGB stars the masers may arise also in dusty disks or tori. Minor contributors are M-supergiants, planetary nebulae, and a few silicate-carbon stars. While the low number of M-supergiants is likely due to the low number of M-supergiants in general, the OH emitting planetary nebulae and silicate-carbon stars are peculiar within their parent population by having non-standard environments. In planetary nebulae amplification of the radio continuum emission might be held reponsible (Uscanga et al. 2012), while the OH masers in silicate-carbon stars may arise like the H2O masers in oxygen-rich disks associated with binary systems containing a carbon star (Szczerba et al. 2006).
The database provides easy access to the information scattered in the literature about Galactic OH masers in the CSEs of late-type stars. This will help to identify efficiently known masers in future surveys, which are planned within the frame of the SKA and its precursor instruments. The Galactic ASKAP survey alone expects to discover several thousand new masers in the Galactic plane and the Magellanic Clouds (Dickey et al. 2013). With SKA, the search for stellar masers will be extended to local group galaxies, and comparisons to the maser population in the Milky Way will then take advantage of the database (Etoka et al. 2015). The database will contribute to satisfying the need for an efficient access to the accumulated knowledge about known masers in the cm wavelength range, which is likely to increase with the rising activities in millimeter and submillimeter maser research triggered by ALMA.
The IVOA identifier is ivo://org.gavo.dc/ohmaser/q/scs
Protocol access URL: http://dc.g-vo.org/ohmaser/q/scs/scs.xml
Protocol access URL: http://dc.g-vo.org/tap
SIMBAD Astronomical Database, Univ. of Strasbourg, http://simbad.u-strasbg.fr/simbad/
Acknowledgments
We thank B. Heidmann and C. Matthies for their support with the maintenance of the database, M. Demleitner for the setup of the VO service, and S. Etoka and the referee for comments on the manuscript. The database and the associated software was constructed as part of the activities of the German Astrophysical Virtual Observatory (GAVO). This work is supported by the Deutsche Forschungsgemeinschaft under grant number En 176/33.
References
- Amiri, N., Vlemmings, W., & van Langevelde, H. J. 2011, A&A, 532, A149 [NASA ADS] [CrossRef] [EDP Sciences] [Google Scholar]
- Bains, I., Cohen, R. J., Louridas, A., et al. 2003, MNRAS, 342, 8 [NASA ADS] [CrossRef] [Google Scholar]
- Benson, P. J., Little-Marenin, I. R., Woods, T. C., et al. 1990, ApJS, 74, 911 [NASA ADS] [CrossRef] [Google Scholar]
- Brunthaler, A., Reid, M. J., Menten, K., et al. 2011, Astron. Nachr., 332, 461 [NASA ADS] [CrossRef] [Google Scholar]
- Chen, P. S., Szczerba, R., Kwok, S., & Volk, K. 2001, A&A, 368, 1006 [NASA ADS] [CrossRef] [EDP Sciences] [Google Scholar]
- David, P., Le Squeren, A. M., & Sivagnanam, P. 1993, A&A, 277, 453 [NASA ADS] [Google Scholar]
- Deguchi, S., Fujii, T., Nakashima, J., & Wood, P. R. 2002, PASJ, 54, 719 [NASA ADS] [CrossRef] [Google Scholar]
- Dickey, J. M., McClure-Griffiths, N., Gibson, J. F., et al. 2013, PASA, 30, 3 [Google Scholar]
- Dickinson, D. F., & Turner, B. E. 1991, ApJS, 75, 1323 [NASA ADS] [CrossRef] [Google Scholar]
- Elitzur, M. 1992, Astronomical Masers, Astrophys. Space Sci. Lib., 170, 365 [Google Scholar]
- Engels, D. 1979, A&AS, 36, 337 [NASA ADS] [Google Scholar]
- Engels, D. 2002, A&A, 388, 252 [NASA ADS] [CrossRef] [EDP Sciences] [Google Scholar]
- Engels, D., & Bunzel, F. 2007, in Astrophysical Masers and their Enviroments, eds. J. M. Chapman, & W. A. Baan (Cambridge University Press), IAU Symp., 242, 316 [Google Scholar]
- Engels, D., & Jiménez-Esteban, F. 2007, A&A, 475, 941 [NASA ADS] [CrossRef] [EDP Sciences] [Google Scholar]
- Etoka, S., Engels, D., Imai, H., et al. 2015, Proc. Science, (AASKA14), 125, pos.sissa.it/cgi-bin/reader/conf.cgi?confid=215 [Google Scholar]
- Gray, M. 2012, Maser Sources in Astrophysics (Cambridge University Press) [Google Scholar]
- Habing, H. J., Sevenster, M. N., Messineo, M., van de Ven, G., & Kuijken, K. 2006, A&A, 458, 151 [NASA ADS] [CrossRef] [EDP Sciences] [Google Scholar]
- Kwon, Y., & Suh, K. 2012, J. Korean Astron. Space Sci., 45, 139 [Google Scholar]
- Le Squeren, A. M., Sivagnanam, P., Dennefeld, M., & David, P. 1992, A&A, 254, 133 [NASA ADS] [Google Scholar]
- Lewis, B. M. 1989, ApJ, 338, 234 [NASA ADS] [CrossRef] [Google Scholar]
- Lewis, B. M. 1991, AJ, 101, 254 [NASA ADS] [CrossRef] [Google Scholar]
- Lewis, B. M. 1994, ApJS, 93, 549 [NASA ADS] [CrossRef] [Google Scholar]
- Lewis, B. M. 1997, ApJS, 109, 489 [NASA ADS] [CrossRef] [Google Scholar]
- Menten, K. M., Lundgren, A., Belloche, A., Thorwith, S., & Reid, M. J. 2008, A&A, 477, 185 [NASA ADS] [CrossRef] [EDP Sciences] [Google Scholar]
- Reid, M. J., Menten, K. M., Zheng, X. W., et al. 2009, ApJ, 700, 137 [NASA ADS] [CrossRef] [Google Scholar]
- Sevenster, M. N., van Langevelde, H. J., Moody, R. A., et al. 2001, A&A, 366, 481 [NASA ADS] [CrossRef] [EDP Sciences] [Google Scholar]
- Sjouwerman, L. O., Lindqvist, M., van Langevelde, H. J., & Diamond, P. J. 2002, A&A, 391, 967 [NASA ADS] [CrossRef] [EDP Sciences] [Google Scholar]
- Szczerba, R., Szymczak, M., Babkovskaia, N., et al. 2006, A&A, 452, 561 [NASA ADS] [CrossRef] [EDP Sciences] [Google Scholar]
- te Lintel Hekkert, P., Versteege-Hensel, H. A., Habing, H. J., & Wiertz, M. 1989, A&AS, 78, 399 [NASA ADS] [Google Scholar]
- te Lintel Hekkert, P., Caswell, J. L., Habing, H. J., Haynes, R. F., & Norris, R. P. 1991, A&AS, 90, 327 [NASA ADS] [Google Scholar]
- Tenenbaum, E. D., Dodd, J. L., Milam, S. N., Woolf, N. J., & Ziurys, L. M. 2010, ApJ, 720, L102 [NASA ADS] [CrossRef] [Google Scholar]
- Uscanga, L., Gómez, J. F., Suárez, O., & Miranda, L. F. 2012, A&A, 547, A40 [NASA ADS] [CrossRef] [EDP Sciences] [Google Scholar]
- Vlemmings, W. H. T., & van Langevelde, H. J. 2007, A&A, 472, 547 [NASA ADS] [CrossRef] [EDP Sciences] [Google Scholar]
- Zijlstra, A. A., Chapman, J. M., te Lintel Hekkert, P., et al. 2001, MNRAS, 322, 280 [NASA ADS] [CrossRef] [Google Scholar]
All Figures
|
Fig. 1 Opening web page for access to the database of OH masers in circumstellar shells. The address is www.hs.uni-hamburg.de/maserdb/. |
| In the text | |
|
Fig. 2 Individual reference page for the main line observations of Dickinson & Turner (1991). Statistics, an external link to the SAO/NASA Astrophysics Data System (ADS), references for additional data, and modifications to the original data in the paper are given. |
| In the text | |
|
Fig. 3 Result from a cone search at the position 18 42 22.2 −08 05 01 (2000) with a search radius of 10′′. The output page displays the content of the main table. The source names are linked to the SIMBAD database. Access to entries in the auxiliary tables (in this case no entries are available) is provided by the links in columns “Mon.” and “Maps”. We note the inclusion of the entry from the te Lintel Hekkert et al. (1989) catalog (LIN89). Although the catalog position is outside the search radius, the observation is listed because of an internal link to the “primary observation” of Engels & Jiménez-Esteban (2007) labeled as ENG07 (see Sect. 3.1). |
| In the text | |
|
Fig. 4 Examples for the content in the main and auxiliary tables of the database for the Mira variable U Her. Top: result from the search in the main table. The columns “Mon.” and “Maps” are activated (Y = “Yes”) for several frequencies, linking to monitoring and interferometric observations at these frequencies compiled in the auxiliary tables. Middle: result from the search in the monitoring table at 1612 MHz. A maximum flux density of 1.5 Jy was reported for U Her during ≈11 yr of monitoring. Bottom: compiled interferometric observations at 1667 MHz. |
| In the text | |
|
Fig. 5 Distribution of the 1612 MHz peak flux densities (upper panel) and expansion velocities (lower panel). The maxima are at fpeak ≈ 0.5 Jy and vexp ≈ 14 km s-1. About a dozen sources with vexp = 40−80 km s-1 are excluded from the plot. |
| In the text | |
|
Fig. 6 Statistics of 2341 detected OH masers in the database. The upper panels show in a) the distribution in Galactic longitudes; and in b) in Galactic latitudes. The lower panels show in c) the distribution on the sky in Galactic coordinates; and in d) the range of Galactic latitudes for given expansion velocities. This last plot uses velocity information from 1967 stars and is truncated at 35 km s-1 for display purposes, excluding 15 sources with vexp = 35−80 km s-1. |
| In the text | |
|
Fig. 7 OH Maser specific luminosity distributions Lν in Watt Hz-1 assuming near kinematic distances. Included are 1456 sources with reliable radial velocities, e.g. having double-peaked spectra at 1612 MHz (unfilled bars). Superposed are the distributions of 461 sources with 1667 MHz emission (bars with light gray shading) and 275 sources with 1665 MHz emission (bars with heavy gray shading). |
| In the text | |
Current usage metrics show cumulative count of Article Views (full-text article views including HTML views, PDF and ePub downloads, according to the available data) and Abstracts Views on Vision4Press platform.
Data correspond to usage on the plateform after 2015. The current usage metrics is available 48-96 hours after online publication and is updated daily on week days.
Initial download of the metrics may take a while.