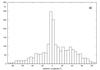
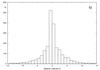
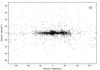
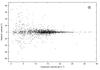
Fig. 6
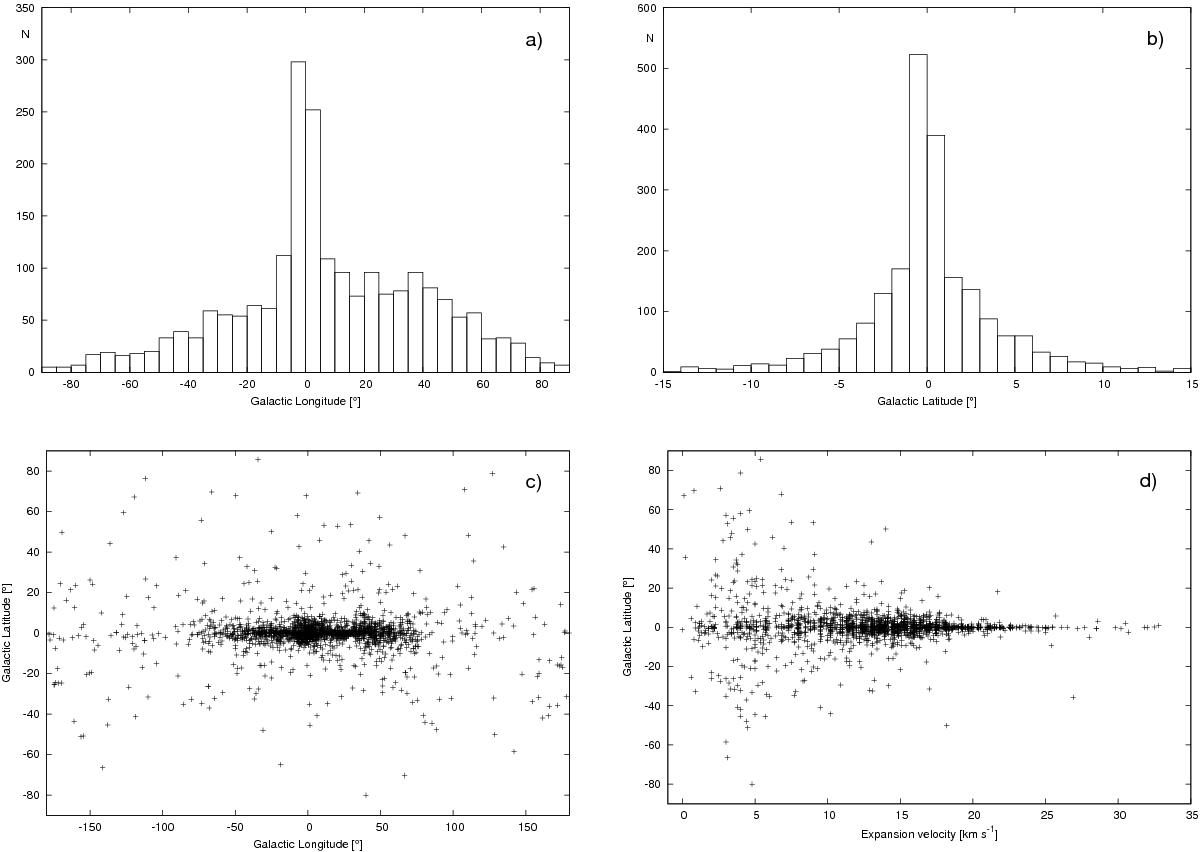
Statistics of 2341 detected OH masers in the database. The upper panels show in a) the distribution in Galactic longitudes; and in b) in Galactic latitudes. The lower panels show in c) the distribution on the sky in Galactic coordinates; and in d) the range of Galactic latitudes for given expansion velocities. This last plot uses velocity information from 1967 stars and is truncated at 35 km s-1 for display purposes, excluding 15 sources with vexp = 35−80 km s-1.
Current usage metrics show cumulative count of Article Views (full-text article views including HTML views, PDF and ePub downloads, according to the available data) and Abstracts Views on Vision4Press platform.
Data correspond to usage on the plateform after 2015. The current usage metrics is available 48-96 hours after online publication and is updated daily on week days.
Initial download of the metrics may take a while.