Fig. 2
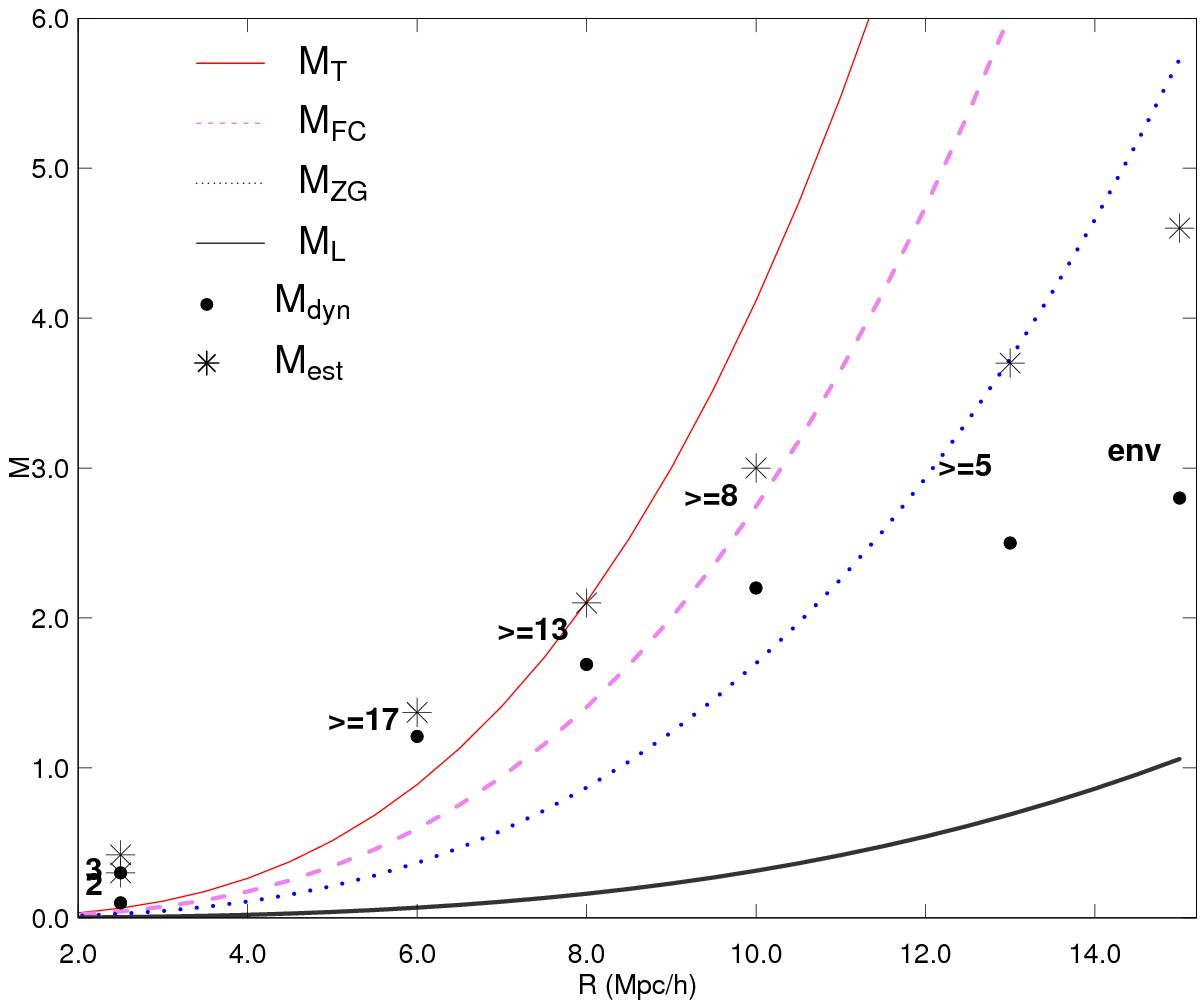
Mass corresponding to the turnaround mass MT(R) (red line), future collapse mass MFC(R) (violet line), zero-gravity mass MZG(R) (blue line), and linear mass ML(R) (grey line; in units of 1015h-1M⊙) versus radius of a sphere R in different dynamical evolution models for Ωm = 0.27. Filled circles show the total masses of galaxy groups in regions of different global density in the A2142 supercluster (Table 2). Stars denote estimated masses as explained in the text. Numbers show global density lower limit for a region (env marks Main+env region, 2 and 3 denote regions of galaxy groups in the tail of the supercluster).
Current usage metrics show cumulative count of Article Views (full-text article views including HTML views, PDF and ePub downloads, according to the available data) and Abstracts Views on Vision4Press platform.
Data correspond to usage on the plateform after 2015. The current usage metrics is available 48-96 hours after online publication and is updated daily on week days.
Initial download of the metrics may take a while.