Free Access
Fig. 1
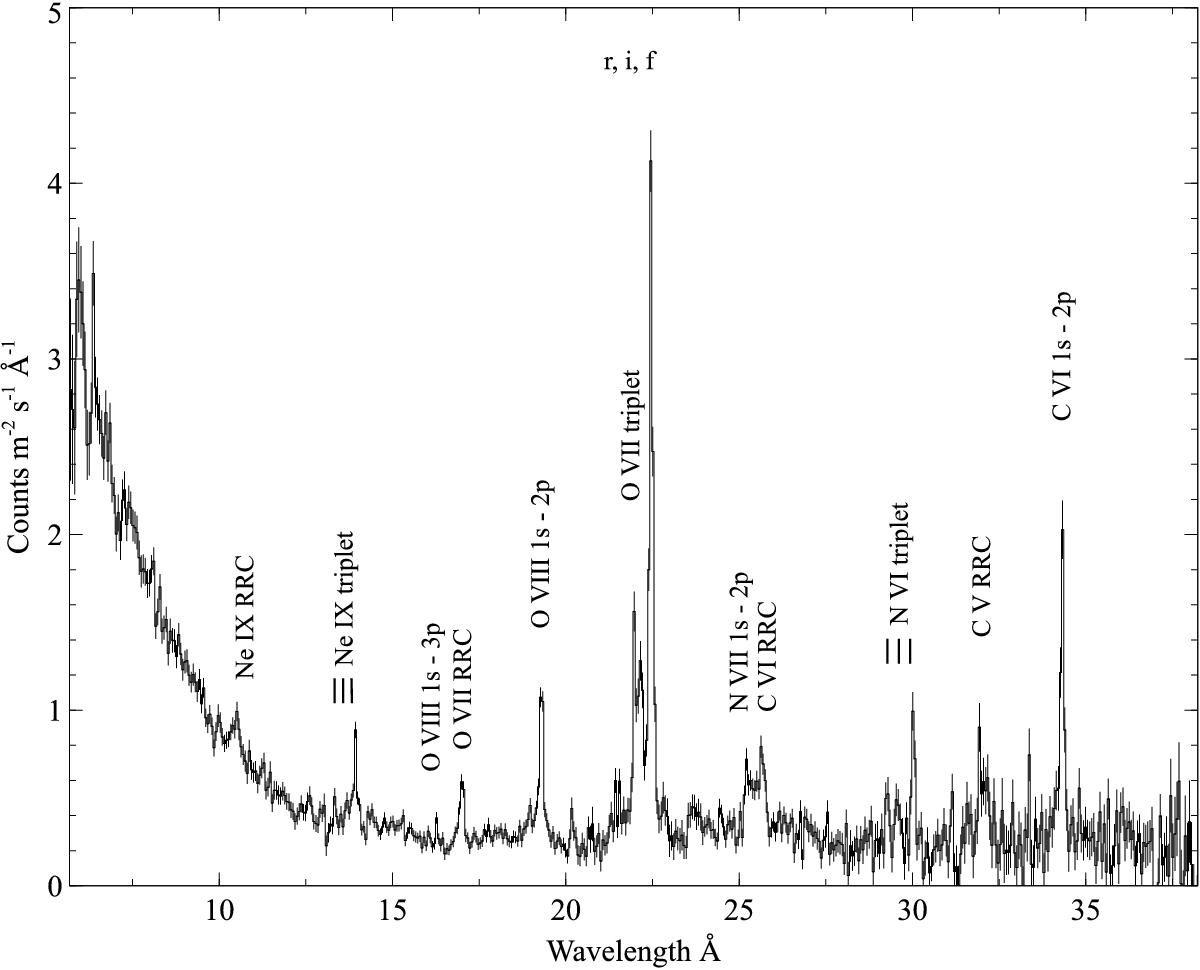
The 2013−14 770 ks stacked RGS spectrum of NGC 5548 (observed frame). The strongest emission lines are labelled. The data points are shown in black. The data have been binned by a factor of two for clarity.
Current usage metrics show cumulative count of Article Views (full-text article views including HTML views, PDF and ePub downloads, according to the available data) and Abstracts Views on Vision4Press platform.
Data correspond to usage on the plateform after 2015. The current usage metrics is available 48-96 hours after online publication and is updated daily on week days.
Initial download of the metrics may take a while.