Fig. 9
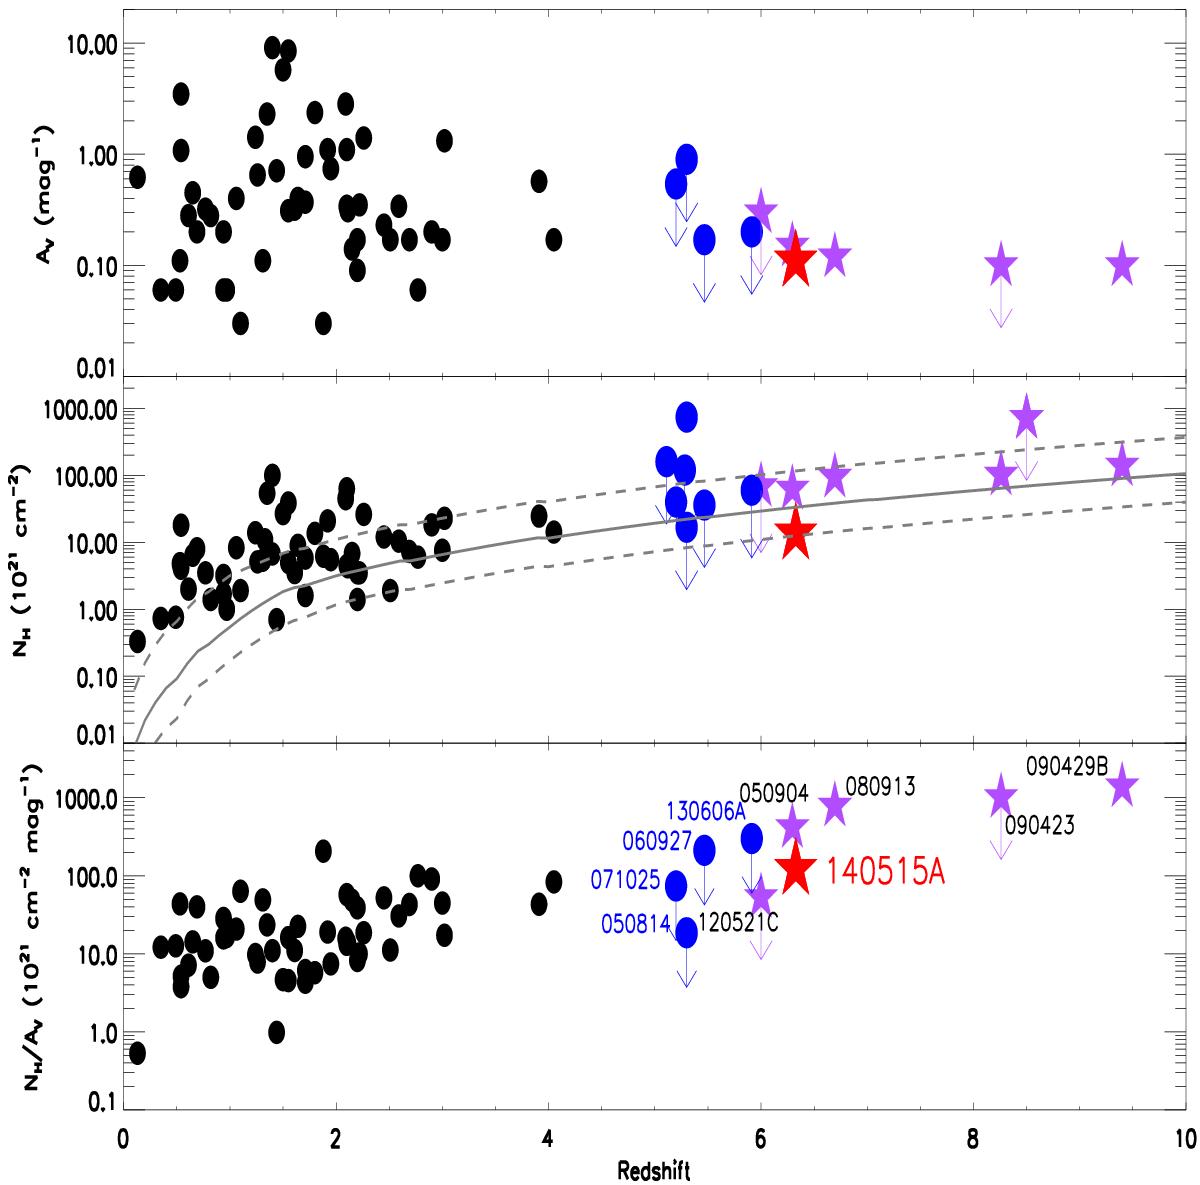
AV, NH, and NH/AV ratio as a function of redshift. Black points are from Covino et al. (2013) for events with z ≲ 4, while the remaining events (blue circles, purple stars) are listed in Table 5. GRB 140515A is marked with a red star. The solid and/or dashed gray lines in the middle panel represent the effect of the intervening material along the line of sight (see Campana et al. 2015; Salvaterra 2015).
Current usage metrics show cumulative count of Article Views (full-text article views including HTML views, PDF and ePub downloads, according to the available data) and Abstracts Views on Vision4Press platform.
Data correspond to usage on the plateform after 2015. The current usage metrics is available 48-96 hours after online publication and is updated daily on week days.
Initial download of the metrics may take a while.