Fig. 8
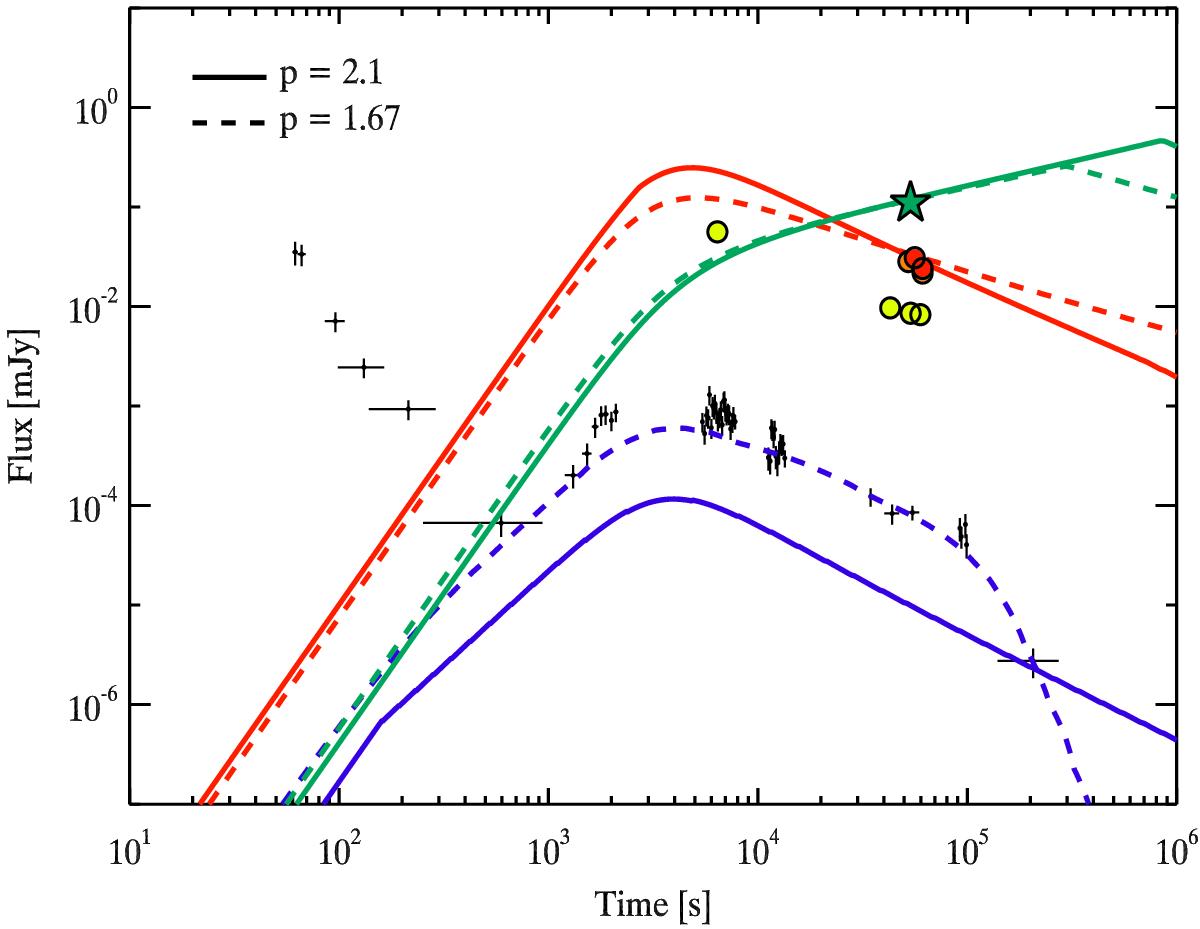
Two multi-wavelength interpretations of the GRB 140515A afterglow light curve in X-ray band (black dots, blue lines), SDSS-z′ band (yellow circles), J band (orange circles), H band (red circles, red lines) and radio band (green star, green lines). Dashed lines represent the solution in the “hard electron spectrum” scenario (p = 1.67). Solid lines describe the solution for the “multi-component” scenario (p = 2.1).
Current usage metrics show cumulative count of Article Views (full-text article views including HTML views, PDF and ePub downloads, according to the available data) and Abstracts Views on Vision4Press platform.
Data correspond to usage on the plateform after 2015. The current usage metrics is available 48-96 hours after online publication and is updated daily on week days.
Initial download of the metrics may take a while.