Fig. 7
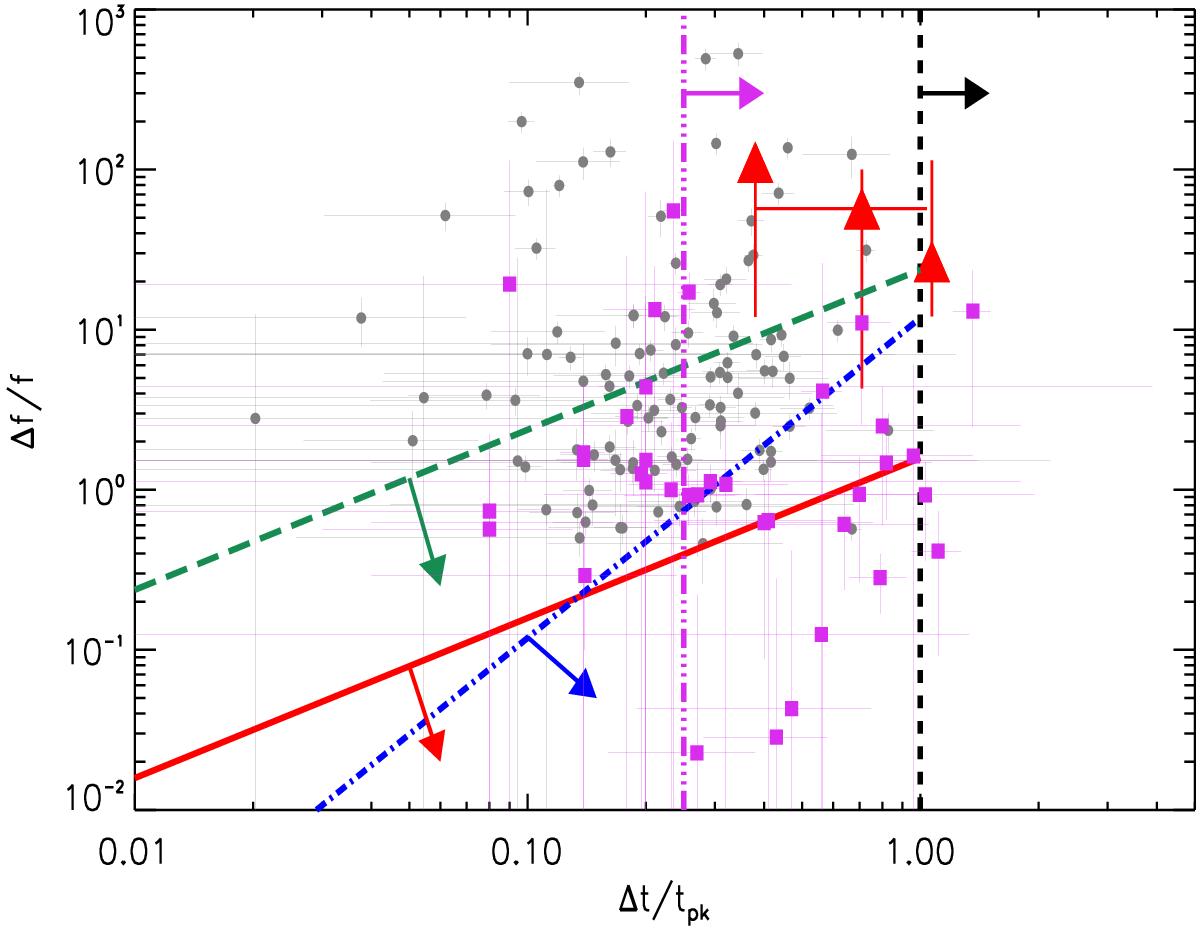
Kinematically allowed regions for afterglow variability in the Δf/f vs. Δt/tpk plane. Coloured lines with arrows represent the permitted regions for density fluctuations on-axis (blue), density fluctuations off-axis (red), multiple density fluctuations off-axis (green), refreshed shocks (pink), and patchy shell (black). (See Ioka et al. 2005; Chincarini et al. 2010; Bernardini et al. 2011, for details.) In this plot we show early-time (tpk ≲ 1 ks, grey points) and late-time (tpk ≳ 1 ks, magenta squares) flares. The red triangles are the three flaring episodes in GRB 140515A. The error bars account for the uncertainty on the behaviour of the underlying continuum: the lower bar corresponds to a flat power-law decay after 103 s, the high bar to a flat decay normalised to the last datapoint, and the central value to a power-law decay consistent with the slope of the optical light curve after 103 s.
Current usage metrics show cumulative count of Article Views (full-text article views including HTML views, PDF and ePub downloads, according to the available data) and Abstracts Views on Vision4Press platform.
Data correspond to usage on the plateform after 2015. The current usage metrics is available 48-96 hours after online publication and is updated daily on week days.
Initial download of the metrics may take a while.