Fig. 6
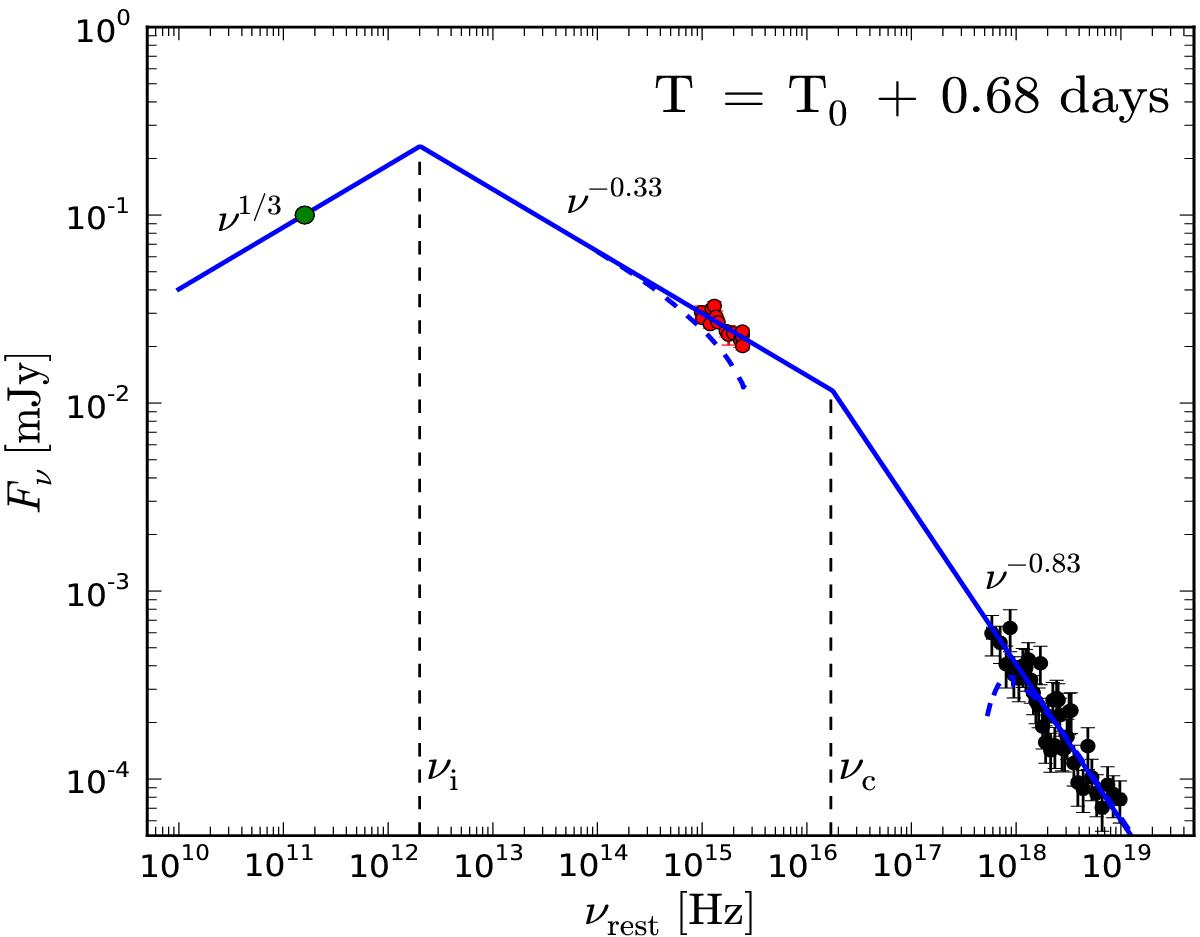
Spectral energy distribution (solid line) obtained with X-Shooter (red) and XRT data (black), corrected for the rest-frame AV and NH respectively. We also included the radio detection (green) of Laskar et al. (2014). The dashed blue line represents the extinction uncorrected best-fit. Dashed lines indicate the position of the injection frequency (νi = 2 × 10¹² Hz) and the cooling frequency (νc ~ 2 × 10¹⁶ Hz) expected for a pure synchrotron model.
Current usage metrics show cumulative count of Article Views (full-text article views including HTML views, PDF and ePub downloads, according to the available data) and Abstracts Views on Vision4Press platform.
Data correspond to usage on the plateform after 2015. The current usage metrics is available 48-96 hours after online publication and is updated daily on week days.
Initial download of the metrics may take a while.