Fig. 5
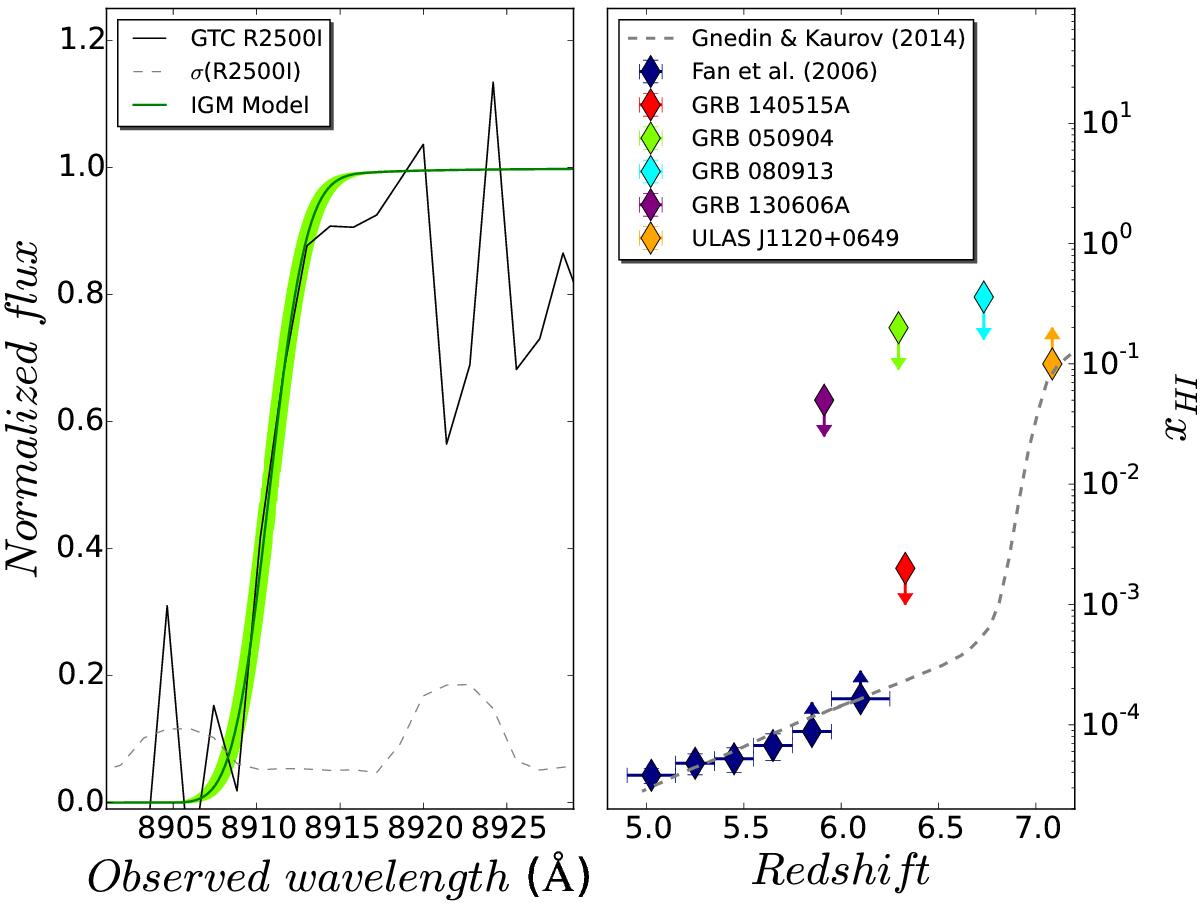
Left: best IGM damping wing fit to the spectrum of GRB 140515A. Right: redshift evolution of the hydrogen neutral fraction. The dotted line shows the Gnedin & Kaurov (2014) model and points to (see legend) the observational measurements of this quantity (data from Totani et al. 2006; Patel et al. 2010; and Chornock et al. 2013). Points with arrows are lower or upper limits.
Current usage metrics show cumulative count of Article Views (full-text article views including HTML views, PDF and ePub downloads, according to the available data) and Abstracts Views on Vision4Press platform.
Data correspond to usage on the plateform after 2015. The current usage metrics is available 48-96 hours after online publication and is updated daily on week days.
Initial download of the metrics may take a while.