Fig. 2
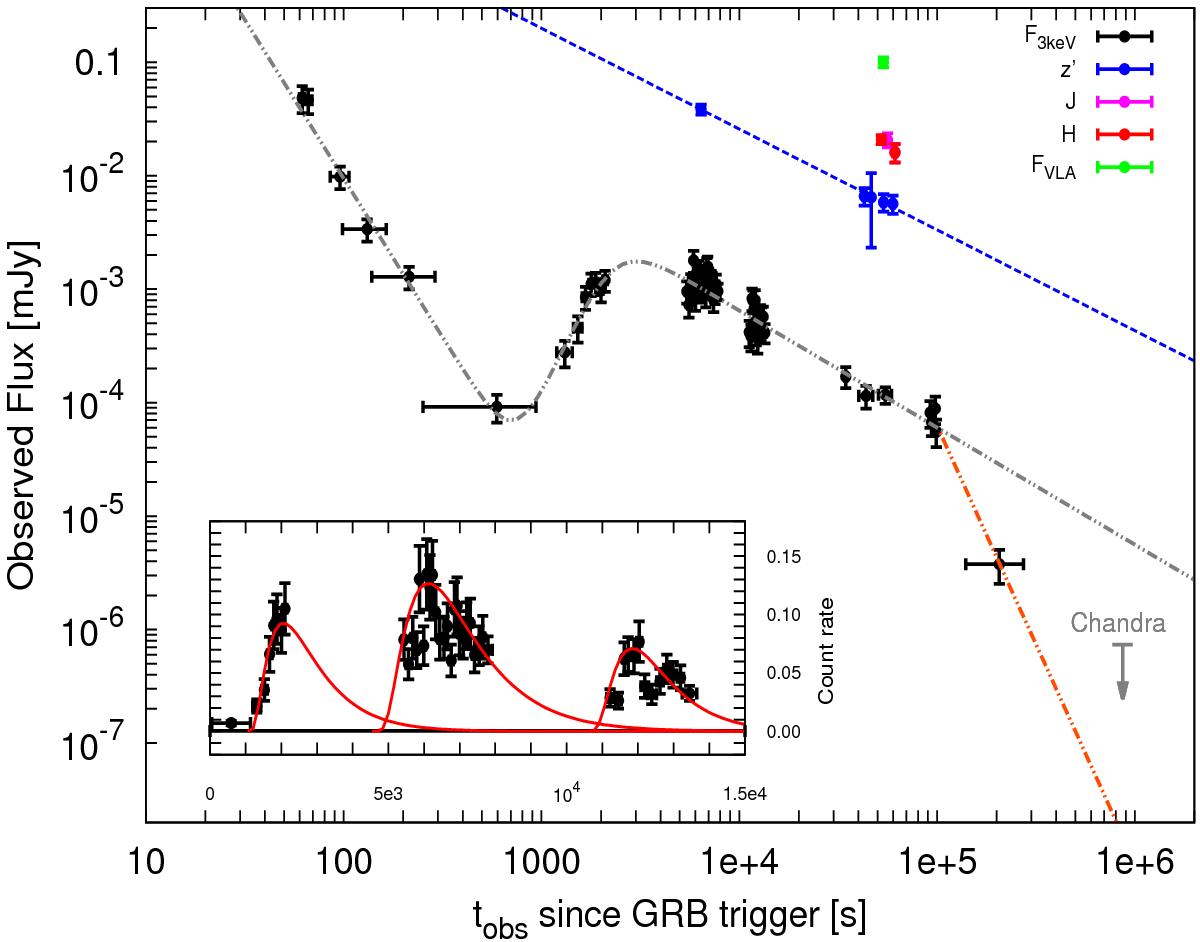
Observed multi-wavelength light curve of GRB 140515A. We report the best fits for the optical (blue) and X-rays (grey) band. The orange line shows the possible decay of the late-time X-ray afterglow, assuming a possible jet break. Inset: the time interval of the X-ray bump on a linear scale. Red curves represent three independent flaring episodes. This is discussed further in Sect. 4.1 and Fig. 7.
Current usage metrics show cumulative count of Article Views (full-text article views including HTML views, PDF and ePub downloads, according to the available data) and Abstracts Views on Vision4Press platform.
Data correspond to usage on the plateform after 2015. The current usage metrics is available 48-96 hours after online publication and is updated daily on week days.
Initial download of the metrics may take a while.